

Register HERE for free. Rob's session is Wednesday, 5/21/25, at 3:25 PM EST
ROAR Score weekly update
Our "Reward Opportunity and Risk" (ROAR) score stays at 40 this week. This means a 2-ETF portfolio that can only be allocated to SPY and BIL would be 40% SPY and 60% BIL.
Through this raucous year to date period, the original 2-ETF (SPY-BIL) ROAR portfolio I invest my own money in is up 3.1%, vs. 1.5% for SPY and 1.9%. More importantly (to me, at least) is that SPY's low point for 2025 so far versus the start of the year was -15.0%. For the ROAR portfolio, the low point was -0.6%. Risk management is alive and well.
I refer to it as the "original" 2-ETF ROAR portfolio because thanks to the great feedback we have received from subscribers and followers, we are creating a broader series of 2-ETF portfolios. We'll publish more on that soon.
3 Quick Thoughts on markets
The market climate since the pandemic faded in 2021-2022 has been simply maddening. So much of the "old reliable" approach to managing wealth has proven to be less effective. I have strong opinions as to why, and that is the focus of my Money Show presentation tomorrow, as well as a separate Sungarden live event we aim to have next month.
The bond market is still the tail that wags the stock market dog. And for the first time in many years, I am closely examining the bond market for its potential use as a portfolio "anchor."
Economic data is very light this week, and earnings season is mostly over except for NVDA next Wednesday. So here's what I'm wondering: when will investors start counting down those 90 days until the tariffs are live again? Not many deal headlines around.
3 ETF (or index) charts I’m watching
Europe stocks are breaking out. Hard to trust any such move, but this is a weekly chart so this is worth keeping an eye on. Lots of Wall Streeters chatting up non-US stocks, which have led to start the year.

Gold was everyone's favorite it seemed. It rallied and looked like a moonshot. But the momentum has stopped. This is what we call "no man's land."

This is industrials, but many sectors have similar looking charts. Not bullish, but not yet bearish.

3 stock charts I’m watching
AAPL continues to be listless, technically speaking. In fact, that looks like a budding downtrend on the right side of the chart, and it has been there since the start of the year. Lower lows and lower highs for a stock that is that big a portion of the S&P 500 index translates to a potential lid on market upside for a while.

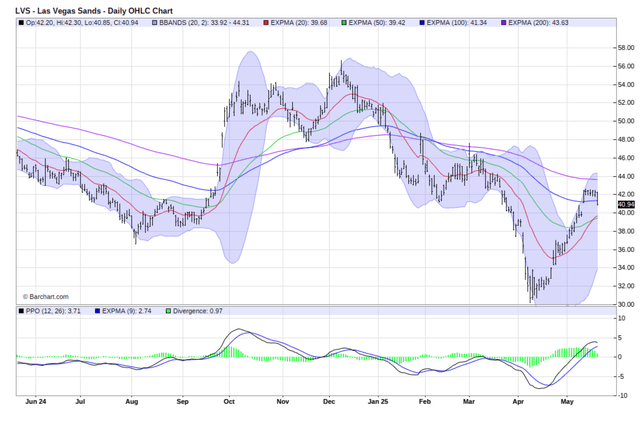
Lots of reporting about how Las Vegas is turning into a ghost town. This chart says to take those seriously, now that the bounce has run the table (couldn't resist a casino pun!).
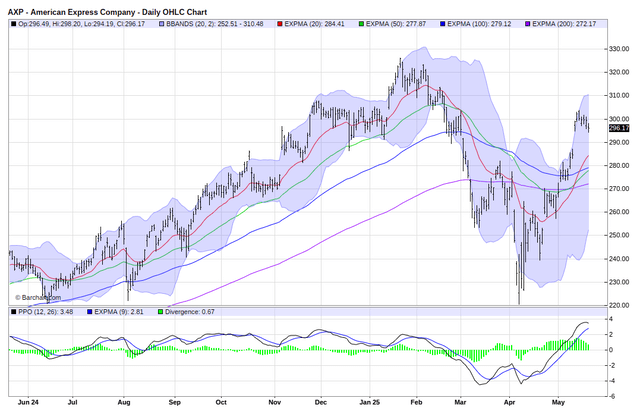
Another Dow Industrials stock that fell down, rallied in a flash, and is already looking tired. The lower portion of the chart, far right side, is what catches my attention here.
Final thoughts for now
4.5% on 10-year bonds, eh? Trapped in a trading range, eh? Remember, from 2011-2022, that rate rarely sat above 3%. But the more US Treasury yields look stuck, the more attractive they become. Not for the obvious reasons, but for risk management purposes. More on that story as it develops.