
INVESTMENT PERFORMANCE UPDATE
Past (live and hypothetical) returns of the ETF Yourself model portfolios. As of 12/19/25.


Here’s the thing about past performance in investing. Every advertisement for an investment that includes performance information has a disclaimer such as this: “past performance is not a guarantee of future results.” That’s absolutely true. However…
There is one thing about past performance that IS a guarantee. We can’t have it. In in the past!
I’m not trying to be cute here. The fact is, past performance of an investment strategy, on the surface, does not tell us anything about how that same approach will work in the market climate of today, or at any point in the future. Markets change, the players involved change, and the effectiveness of strategies that used to work definitely changes.
What shouldn’t change? The OBJECTIVES of a investing strategy. Case in point, the way we run things at ETF Yourself. We have our priorities straight:
Avoid Big Loss (ABL). A drop from any peak to trough of 10% is about all we’ll allow. Many investors will tell you that can’t be controlled, that market volatility is not something we can do much about. We say they’re not trying hard enough!
Make as much as we can, after doing all we can to take big loss off the table.
Control the range of possible outcomes (ROPO, as we call it). Using our ROAR Score and position sizing techniques, developed and evolved over decades. Including through 7 bear market cycles.
Continuously seek to improve, in good markets and bad. A big part of being an ETF Yourself subscriber is joining us on that journey. We are not a service that is based on “just follow my picks and get rich.” Because that assumes every investor is going to take our work and use it the same way. So instead, we lead by example, walking subscribers through our ongoing thought process.
Our past performance record: what it is and isn’t
We get it. Everyone wants to know “how did you do?” And that’s what show just below. It is a record we think shows a consistent pattern over a long period of time: we manage risk. And by doing so, we achieve consistent long-term results, while skipping the panicky periods most investors go through.
These performance records are presented in 3 parts:
The live record of our 2-ETF Conservative Portfolio, governed by our weekly ROAR Score. We’ve compared it to what we think is a logical benchmark, a conservative mix of 30% stocks/70% bonds as a comparison. This mix has been shared with our subscribers weekly since the start of 2022.
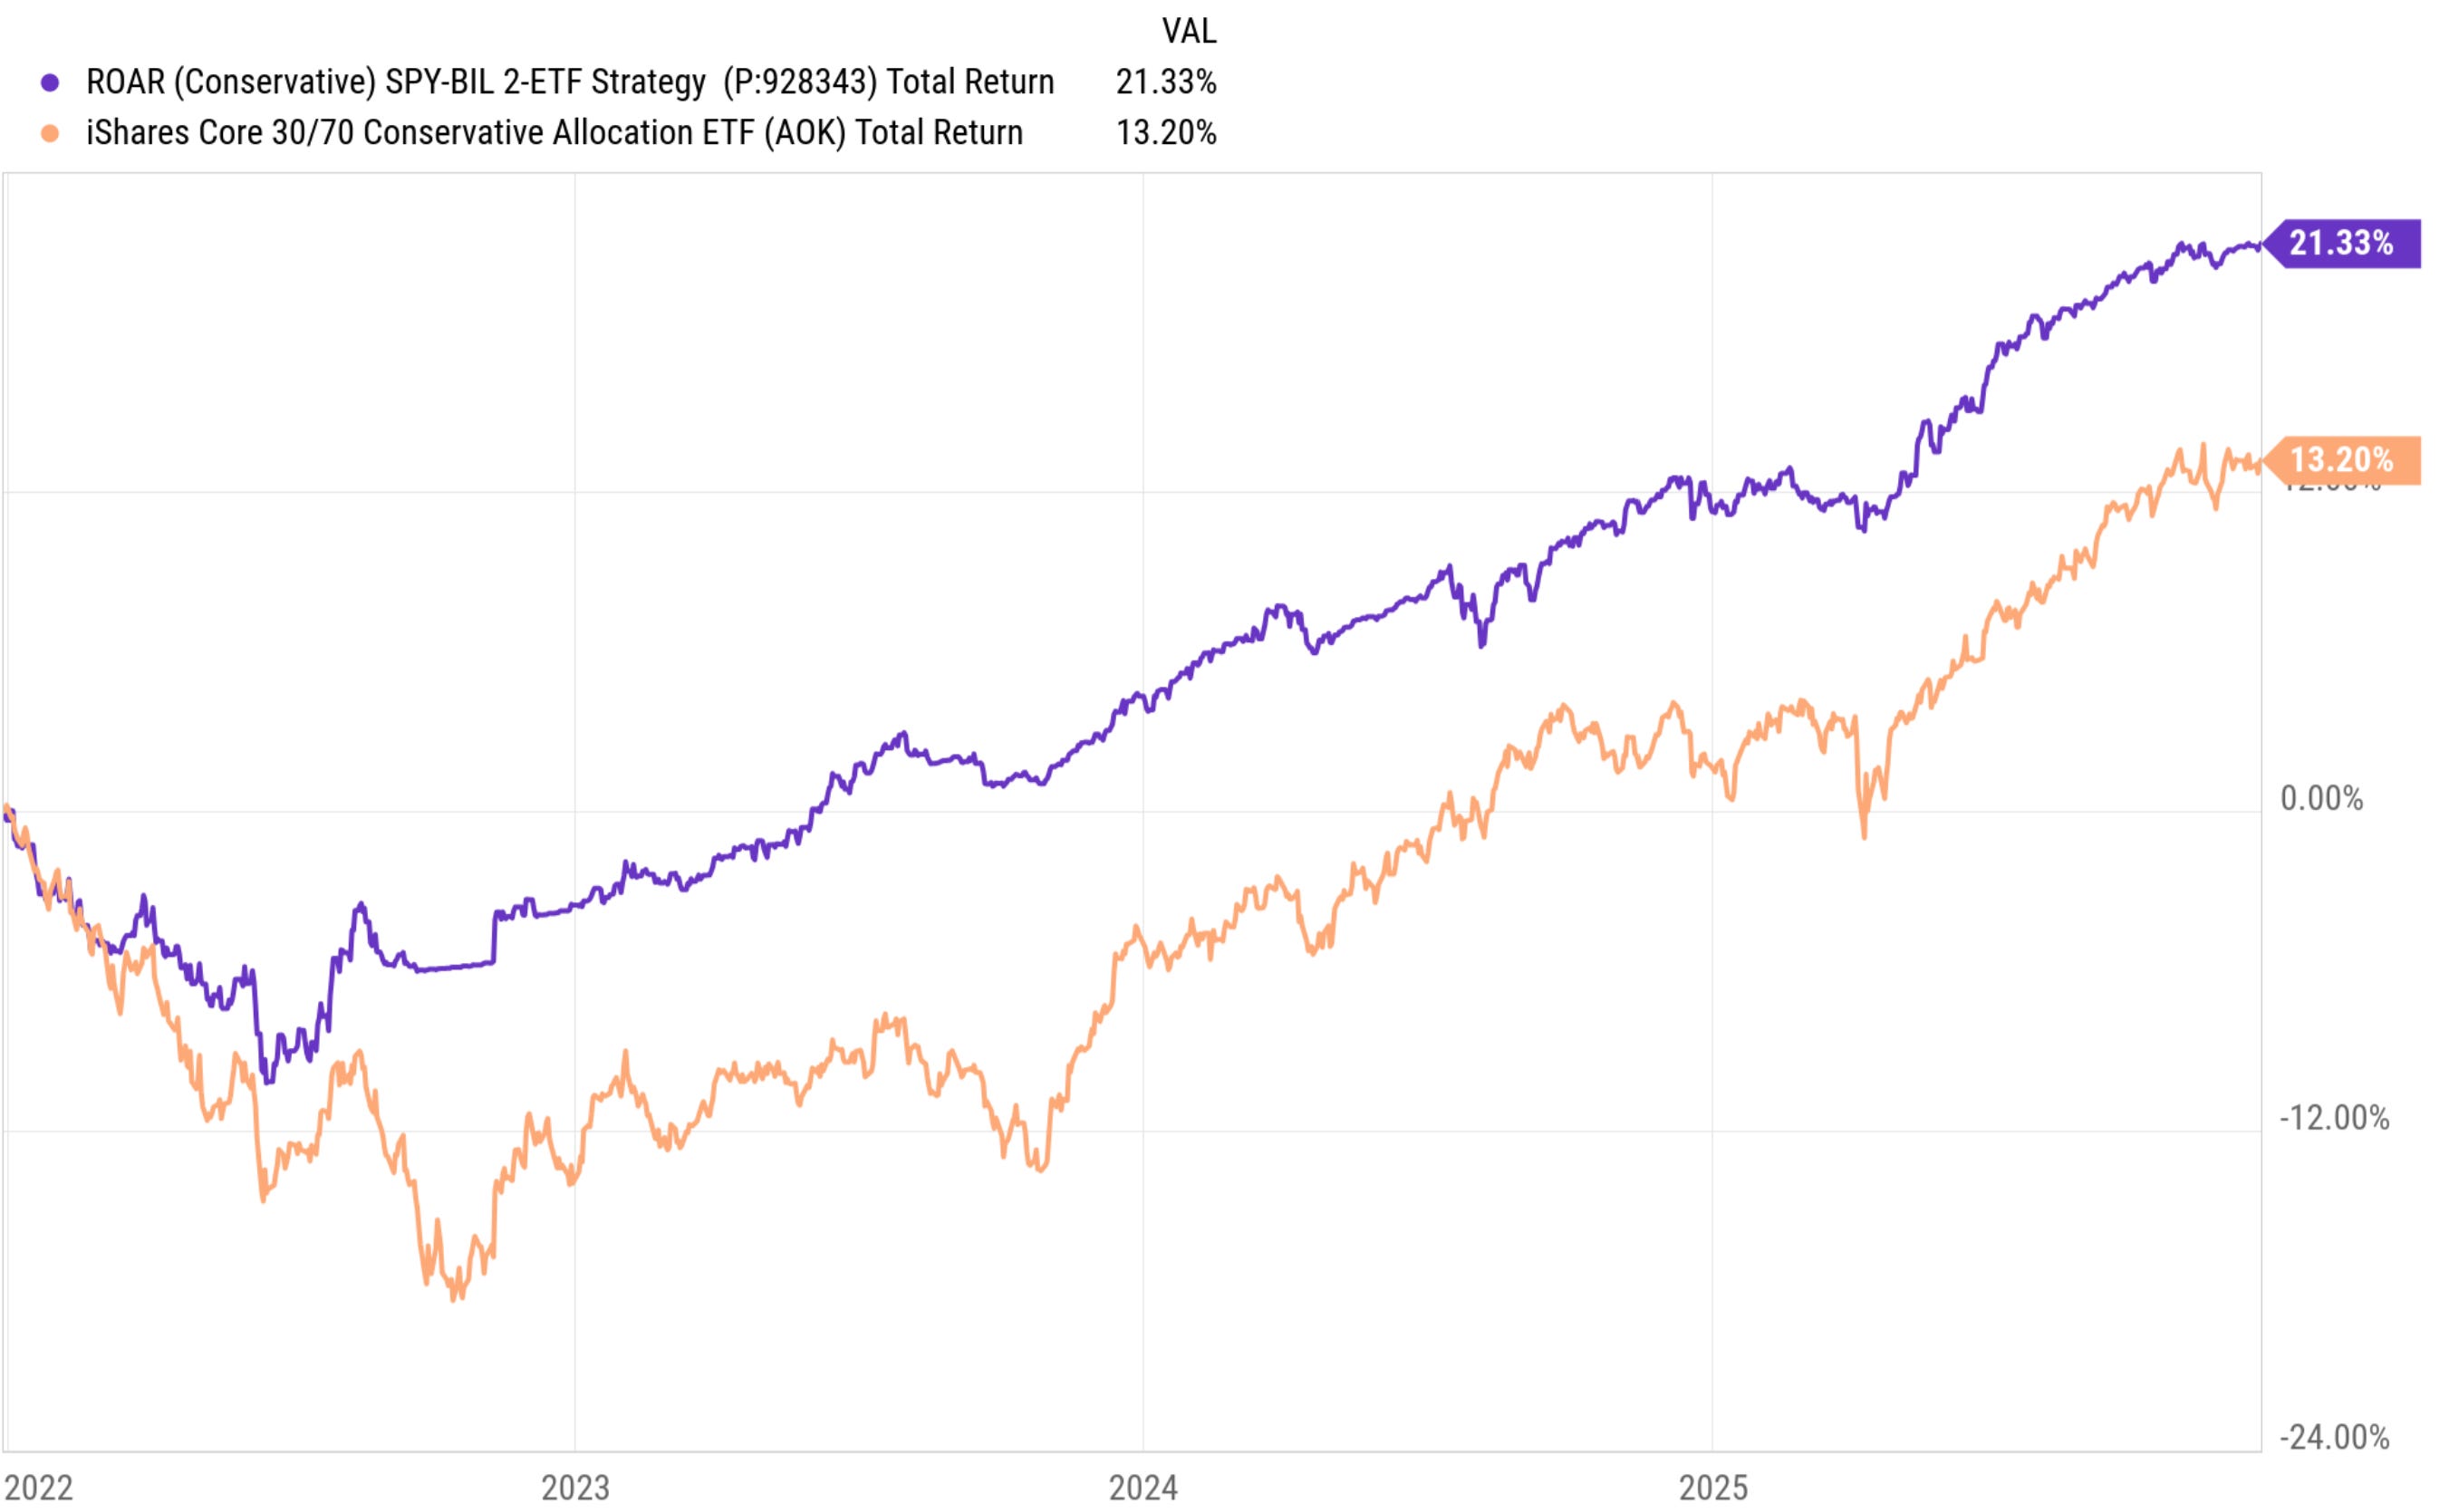
Our conclusion over the past 4 years of running these, and showing them weekly to subscribers? SIMPLE works pretty well!
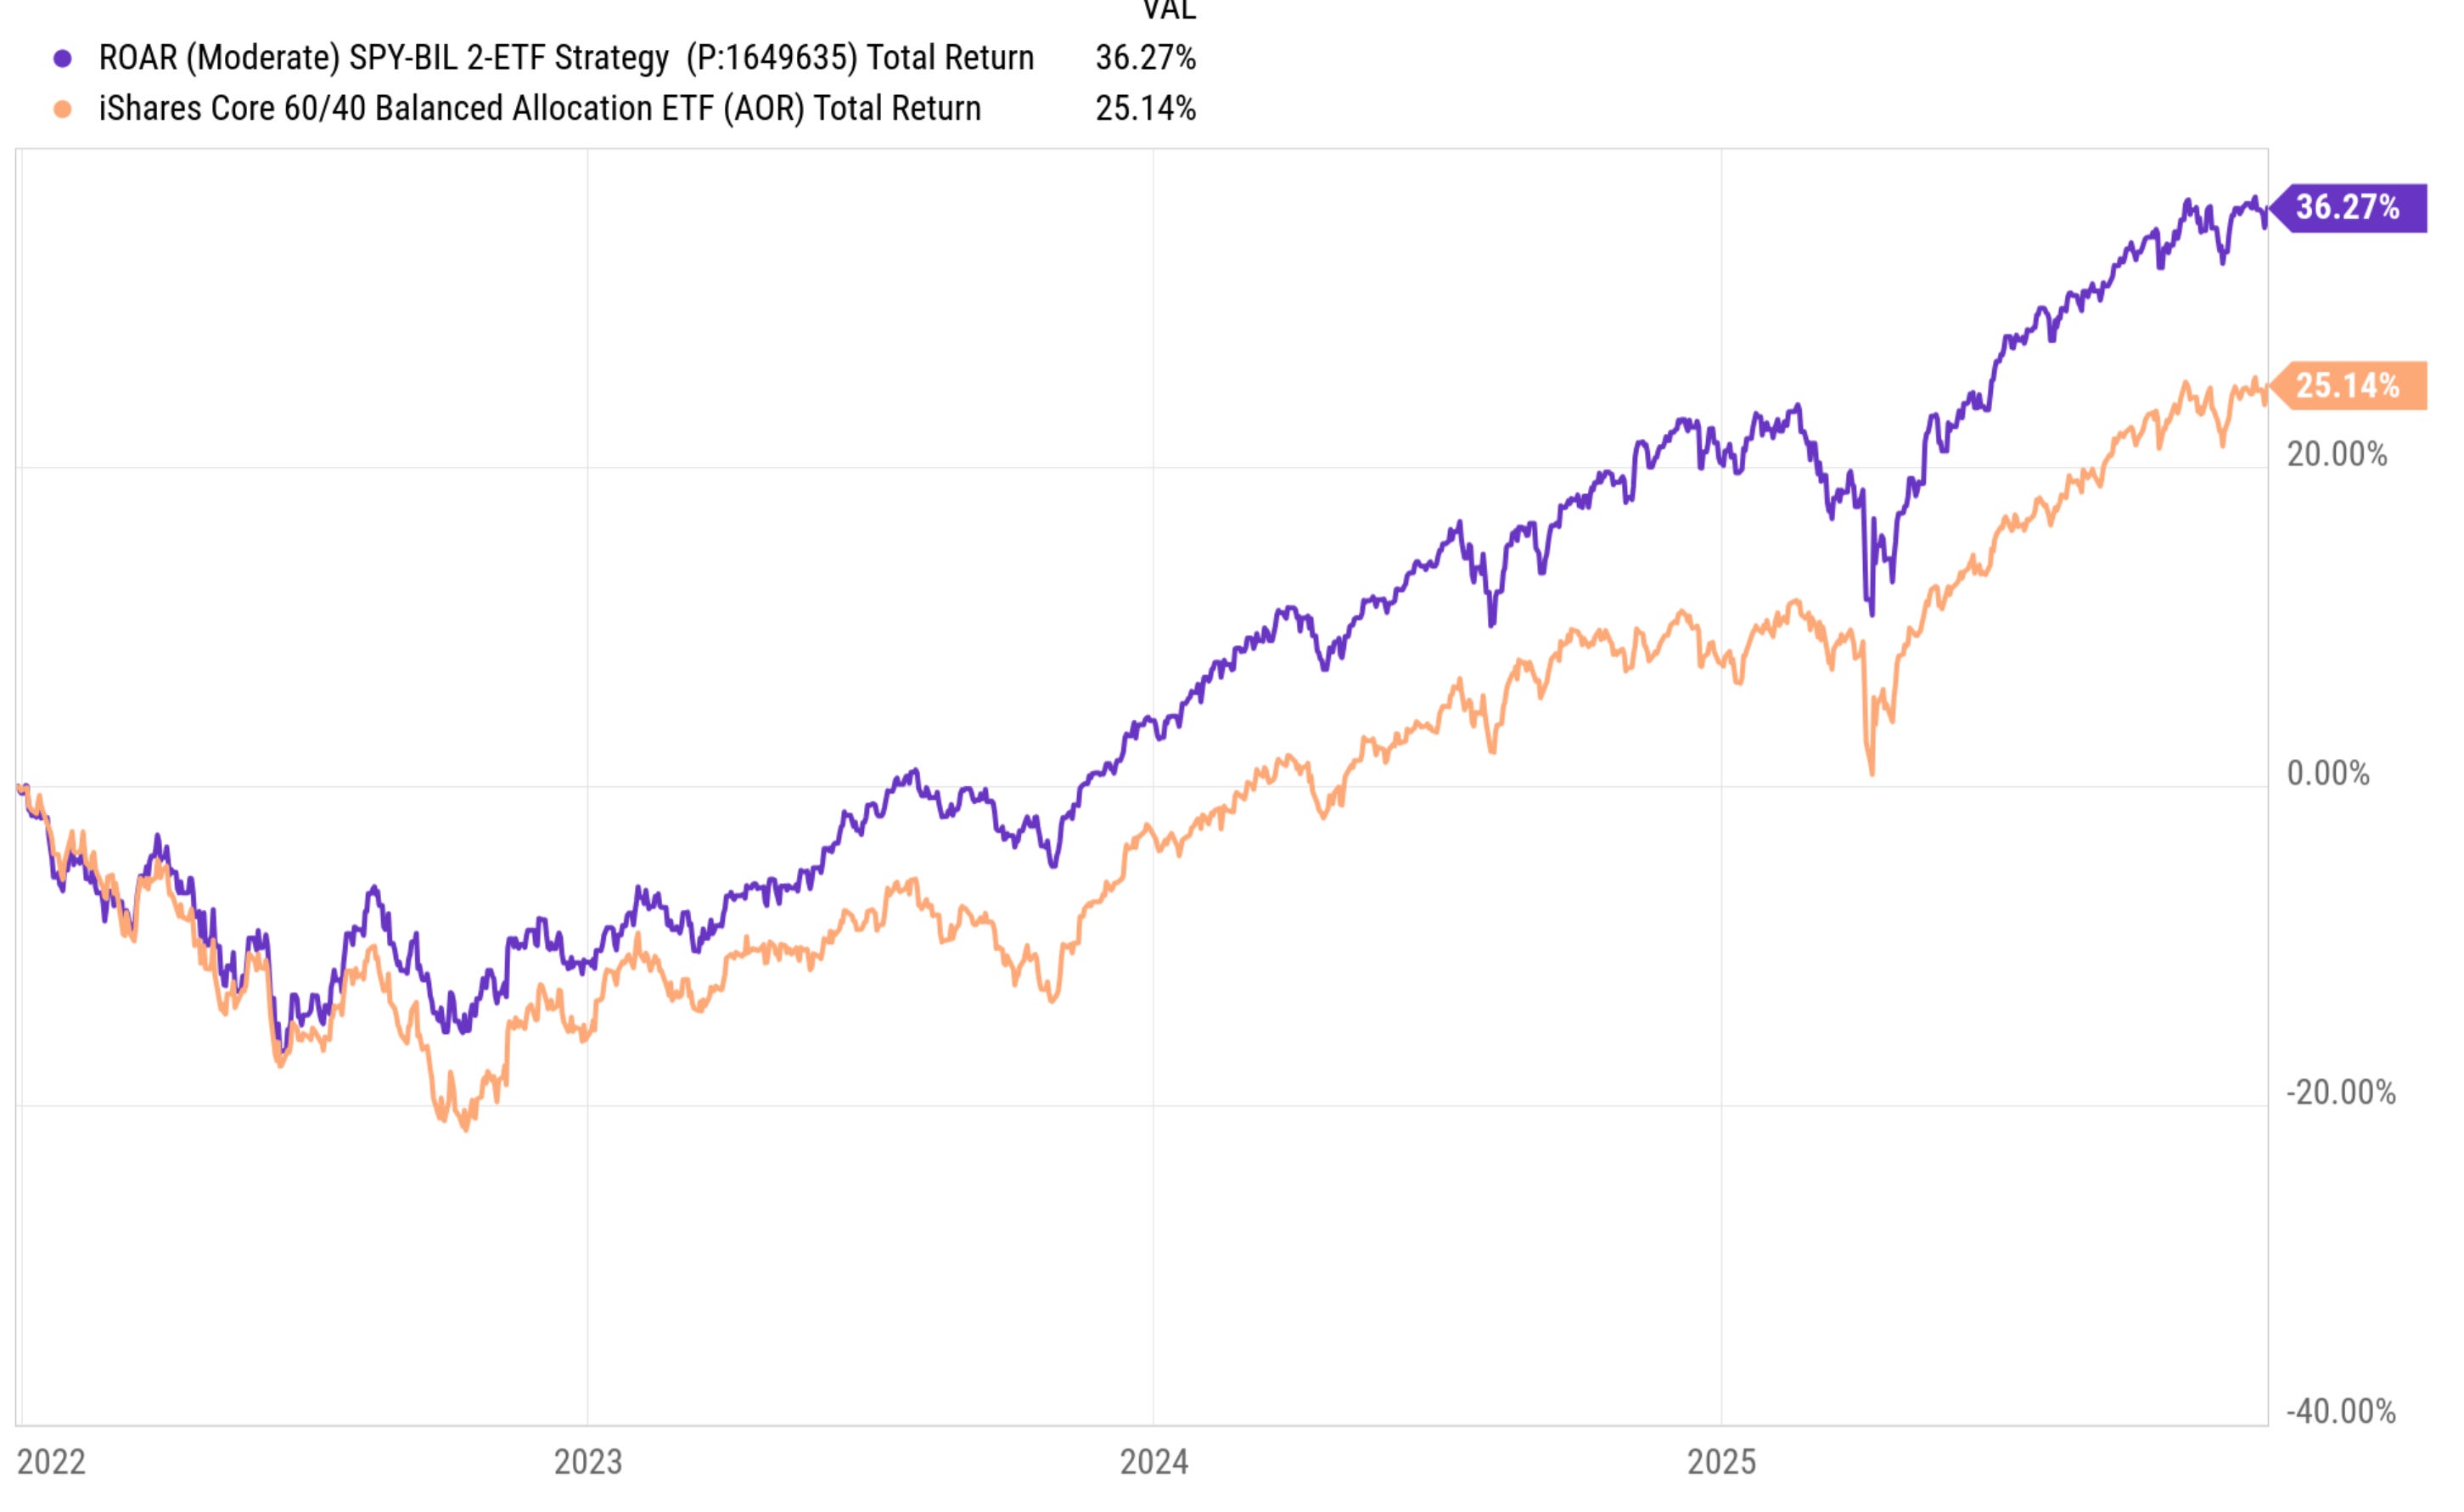
We also share the Moderate version of the same 2-ETF portfolio, which mandates SPY be at least 50% of the portfolio at all times, and allocating the other 50% as per the ROAR Score. This mix has been shared with our subscribers in addition to the Conservative portfolio above, for a while, via our weekly letter. We compare it to a balanced mix of 60% stocks/40% bonds.
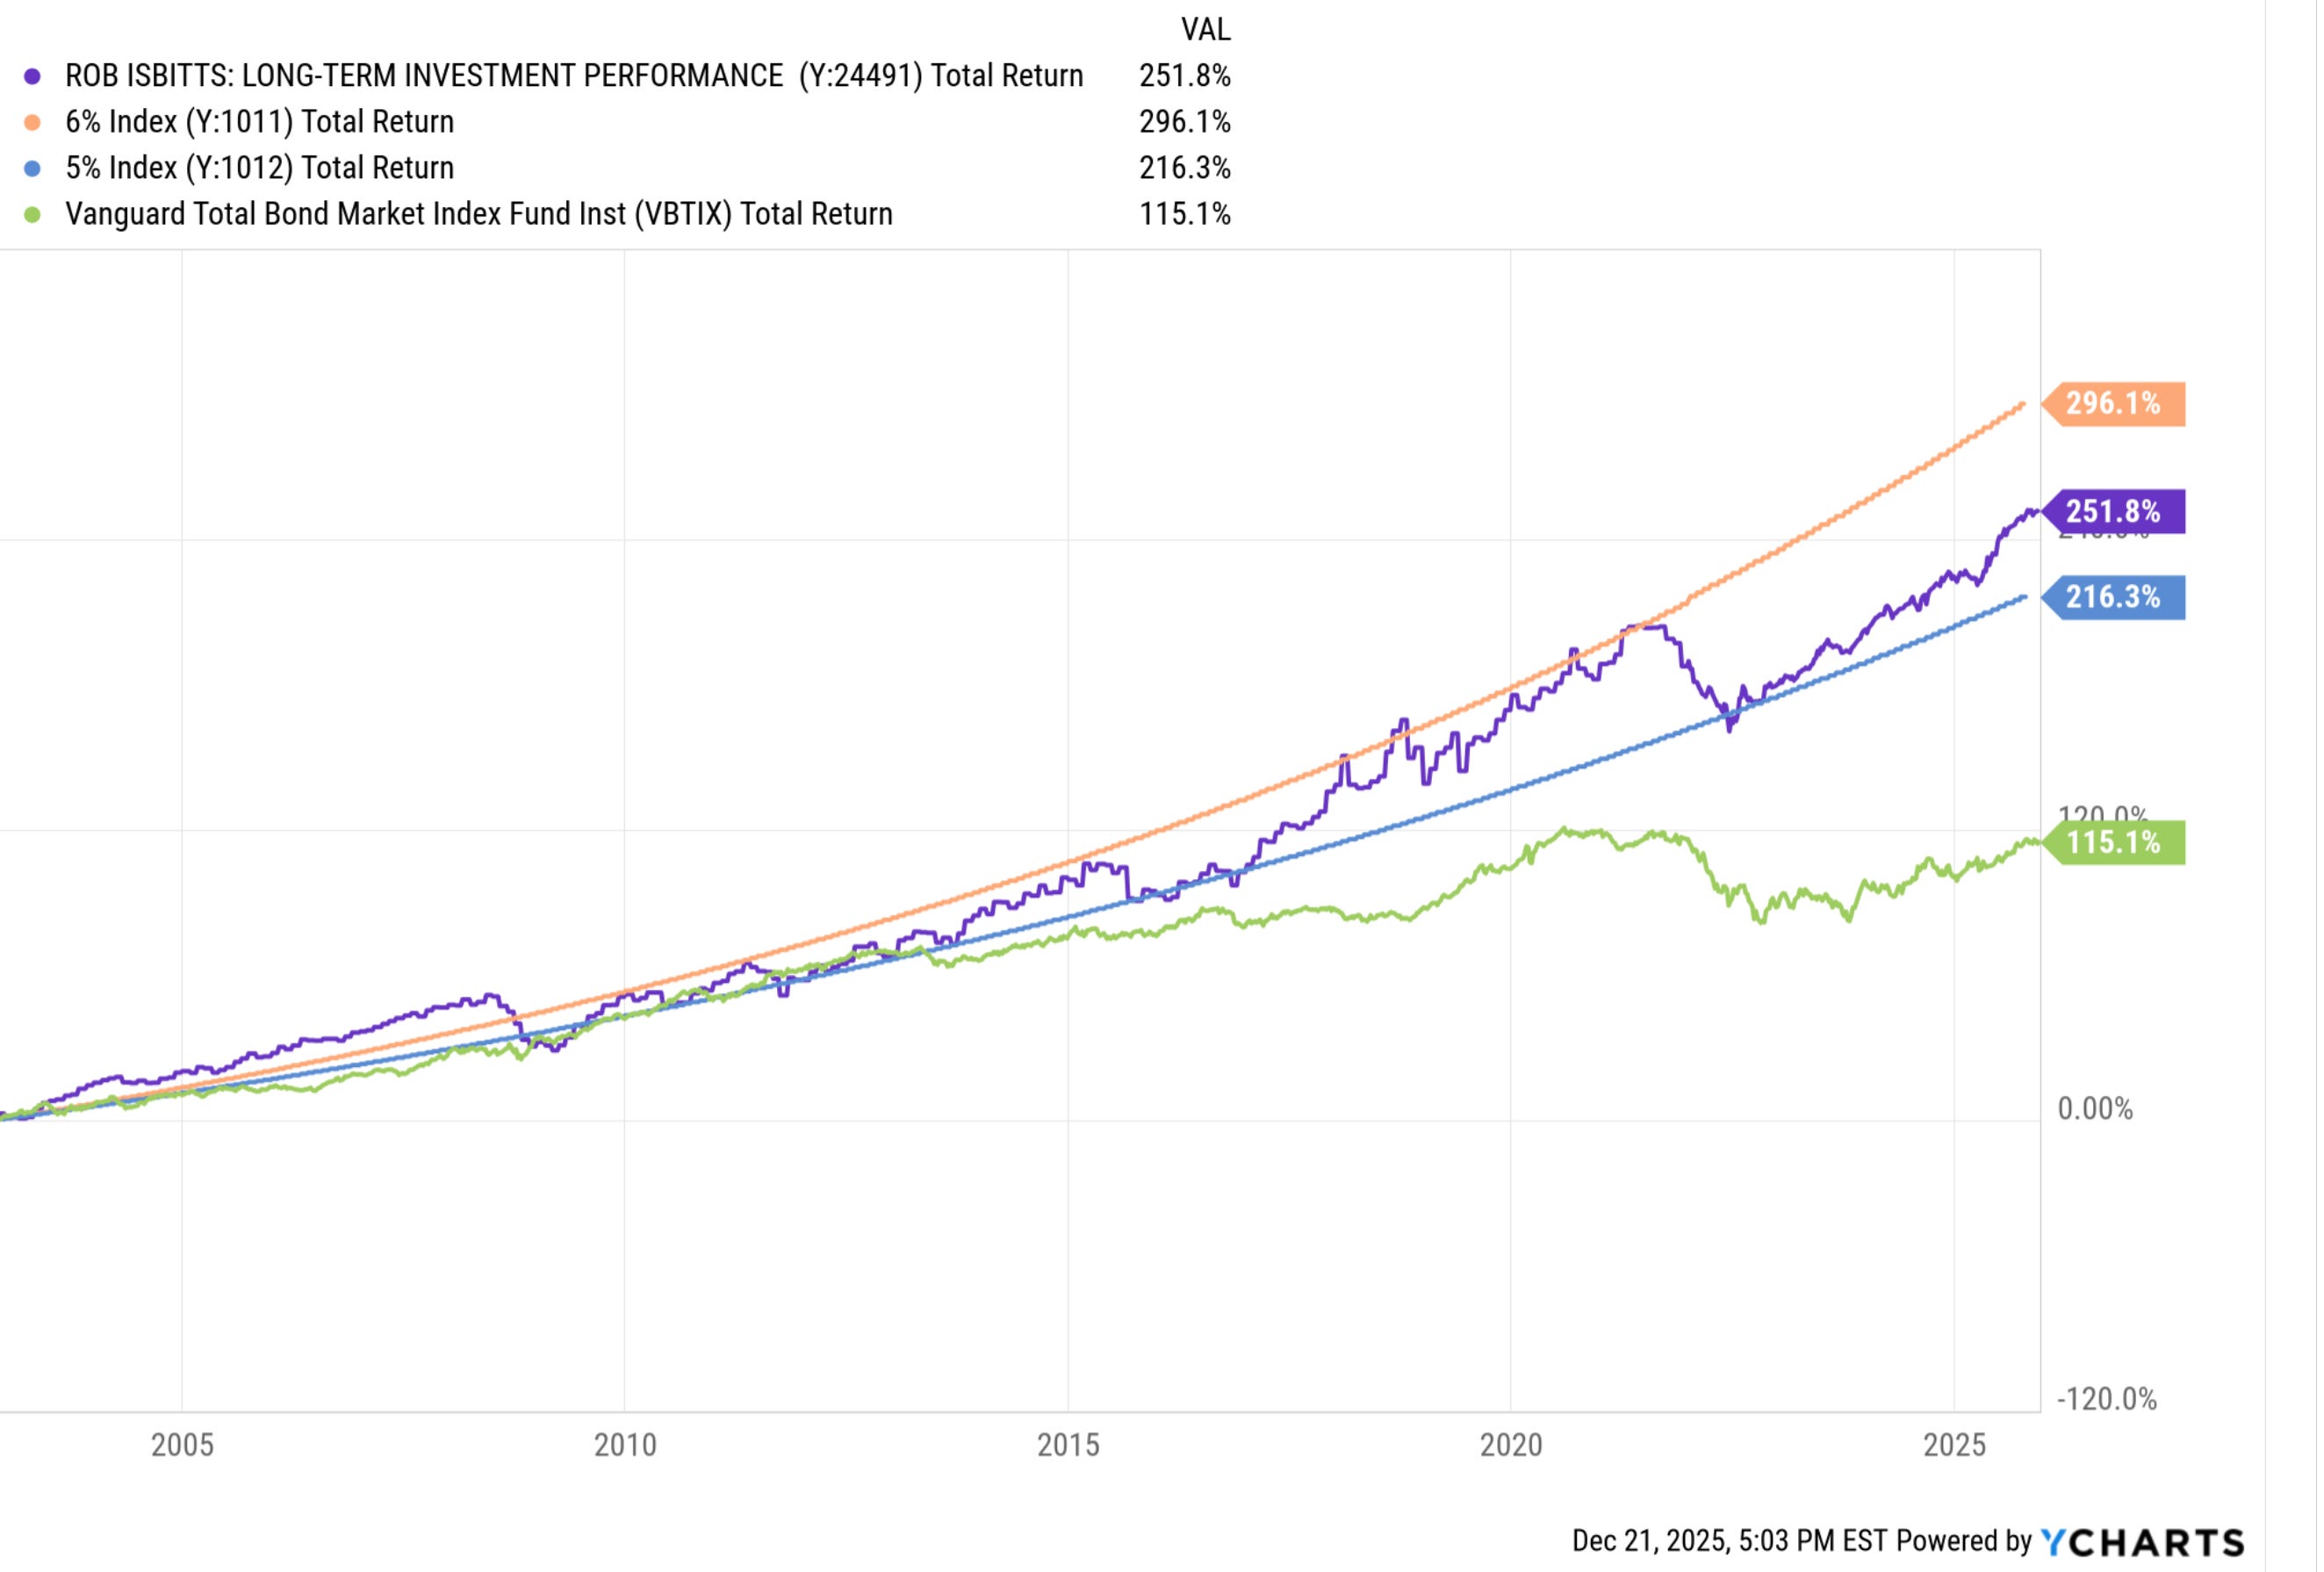
The last performance record shown is one had to go into the proverbial attic to create. It is a mix of Rob Isbitts’ investment returns through multiple segments of his investing career. It goes all the way back to late 2002, and links together what were audited returns from his past life as a fiduciary investment advisor to high net worth families. The benchmarks we chose for this linked-together record of more than 20 years reflect the concepts of low-volatility returns, and the general objective Rob had for his then-clients during most of his advisory career: do better than a total bond portfolio, such as the Vanguard mutual fund shown here. That mandate is still a priority for the Isbitts family in managing their own money, so we included a 5% and 6% annualized return to service as “guardrails” for the live, long-term record (purple line).
Finally, here’s a quick summary of some performance analytics, covering the 3-year period ending 12/19/25. Explanations below this graphic.
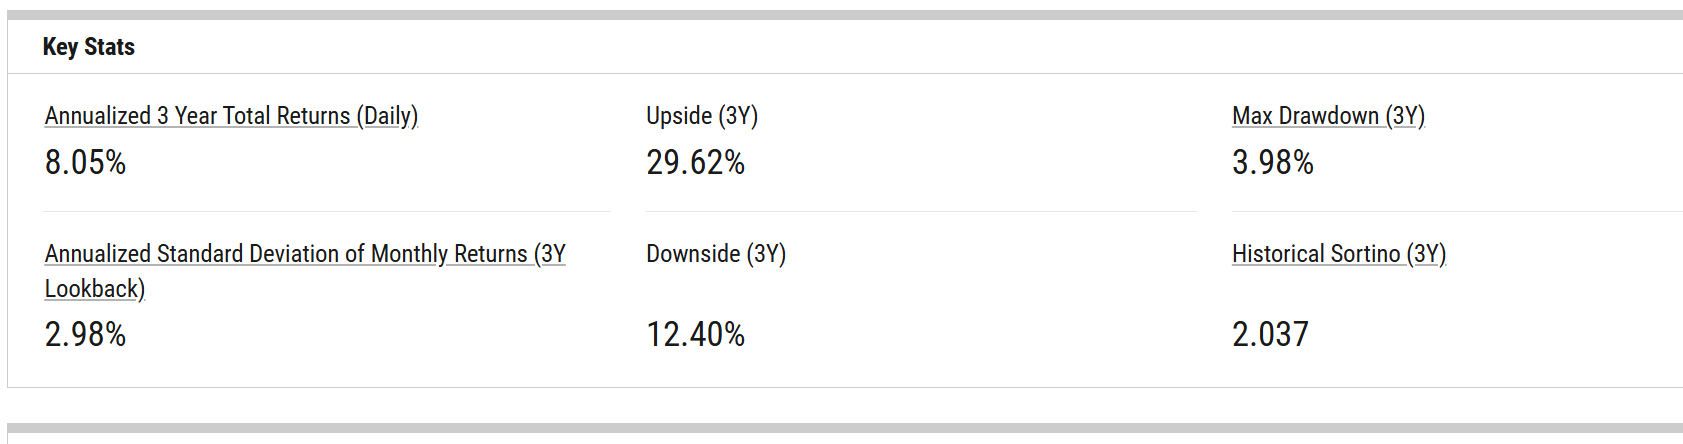
Over this 3-year period, the Conservative 2-ETF portfolio, comprised only of SPY, BIL and using ROAR as an allocation system, produced an annualized return of just over 8%. The standard deviation over that time was only 3%, about half that of both the Conservative Allocation ETF (AOK) and the Vanguard Total Bond Index ETF (BND). That was also about 1/4 the standard deviation of a popular dividend ETF (SCHD), which returned 7.3% of that period.
The upside and downside statistics measure the percentage of the up and down moves of the S&P 500 ETF (SPY) were experienced by the 2-ETF strategy. It captured about 30% of the upside, but only 12% of the downside of SPY over this 3-year period.
Finally, the maximum drawdown for the 2-ETF strategy over this period was less than 4%. BND and SCHD fell by 16-17% each during this time, while SPY had a drawdown of nearly 20%.
The last figure is a “Sortino Ratio,” a standard measure of risk-adjusted return. This allows us to compare investments of different risk levels, on a more direct basis. A Sortino Ratio of more than 2.0 during this period compared favorably to 1.2 for AOK, 0.1 for SCHD and -0.1 for BND.
The bottom-line: over this 3-year period, the simple, easy-to-trade 2-ETF portfolio created for ETF Yourself subscribers. was a significantly more successful form of risk-managed investing.
Importantly, the strategy name and techniques evolved over time. But as we alluded to above in discussing the concept of investment performance, the OBJECTIVES have not changed. Those objectives are what ETF Yourself service is based on. We are not your typical high-risk investment publishing service.
While the modern incarnation of this approach is a simple 2-ETF Conservative portfolio, the predecessor strategies used ETFs, mutual funds, and to a lesser degree, options and stocks, to pursue those same priorities. Back then it was for our clients. Since 2020, when we retired from that business, it has been for our family only.
So, that’s as complete a description of what the performance record below is, and isn’t. It is not “GIPS compliant” which is the standard for investment managers. We had the returns audited at times in the past, but it is not all audited. Frankly, unless someone is selling advisory services based primarily on past performance, there’s not much benefit in taking on the time and expense to meet the very high standards the industry places on it.
But the full record was on actual accounts Rob was the full decision-maker on. And unlike a lot of performance records out there these days, you have a detailed explanation of where it came from.
We’ll continue to provide performance updates if our subscribers think it is important to them to follow along with how we are managing our money, apart from our bond ladder, option collars and trading accounts.