

Here is what we believe is the very best indication of how Rob’s investment research has played out since the start of 2022. To us, that is the “modern market” period, post-pandemic, and in a new major cycle of non-zero interest rates. Analyzing returns prior to this era is still useful when it comes to assessing volatility, but less so when it comes to “bottom line returns.
There are 3 charts below. They each contain a version of the Sungarden Simple portfolio Rob has managed with part of his own assets since introducing the ROAR Score at the beginning of 2022.
These portfolios do not aim to represent the entirety of the Sungarden investment process that is delivered continuously to club members. However…
Every aspect of our work, from the basic 2-ETF structure, to our ETF-driven portfolios, to the relative complexity of our stock and options portfolios, starts with the same basic analysis: how much risk is attached to the reward I seek in the current market climate?
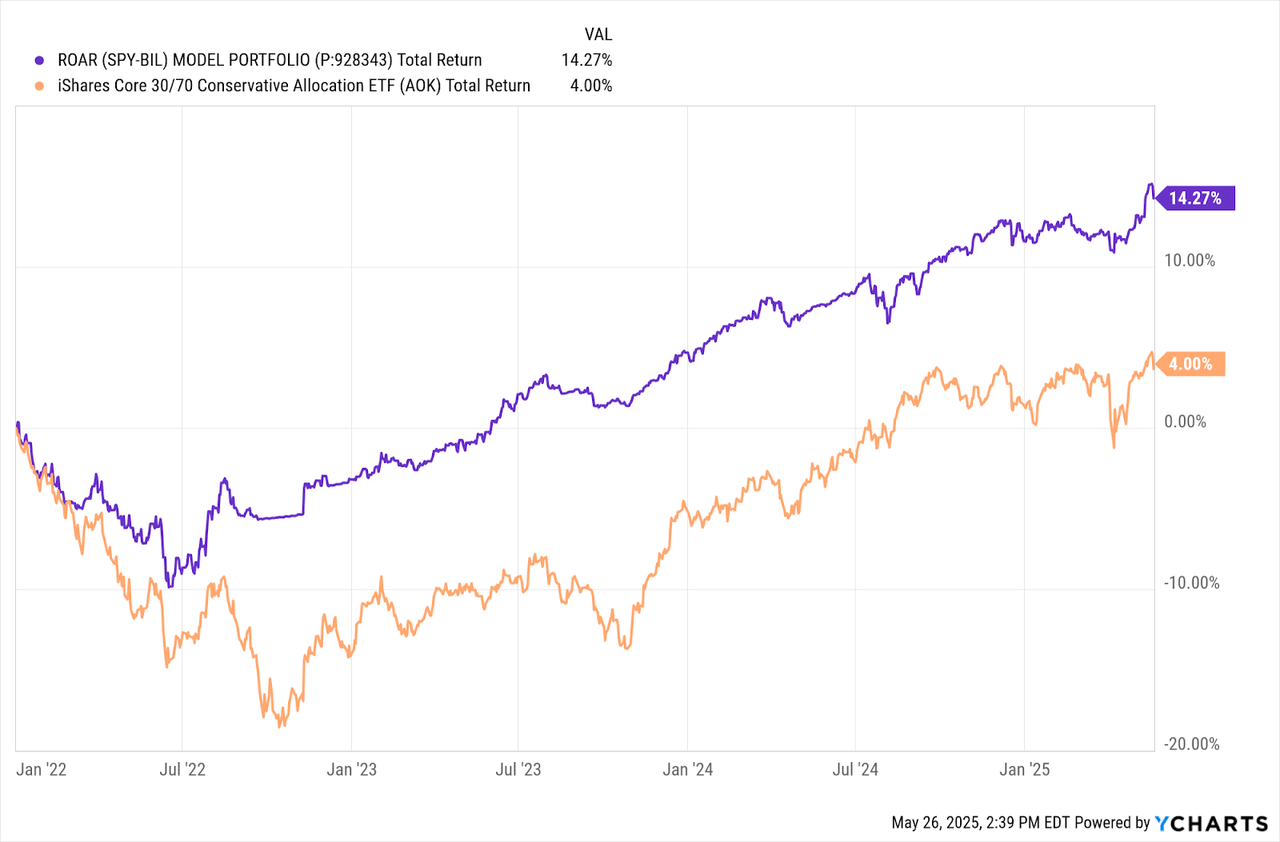
These results show the actual returns of an account whose only two investment choices are an S&P 500 ETF (SPY) and a 1-3 month T-bill ETF (BIL). Every Tuesday (and as needed beyond that), the ROAR Score is updated, based on Rob’s assessment of reward (upside potential) and risk (of major loss) over the next 3-6 months. This is a single number, generated by a combination of several factors (price analysis, market sentiment, valuation, geopolitics, etc.), with Rob making the final decision each week and communicating that to club members through our weekly letter, The 3s Report.
For example, if ROAR is 30, that means a portfolio which can only allocate to SPY and BIL would currently be invested 30% in SPY and 70% in BIL. If ROAR then rose to 40, Rob would sell 10% of BIL and use it to buy 10% more SPY.
The first chart is the original 2-ETF ROAR Score portfolio, which is measured against a “conservative” balanced index ETF (symbol AOK). However, as we spoke to club members, it became clear that this simple but powerful concept demanded more versions of the ROAR Score portfolio. So far, we have designed two additional “tilts” on that original SPY-BIL mix.
They both use only SPY and BIL to allocate, but they have an important additional rule: in the “moderate” version, SPY cannot be below a 30% allocation, and in the “aggressive” version, SPY cannot be below a 50% allocation. So, if the ROAR Score was 40, the separate versions of the Sungarden Simple Portfolios’ allocation to SPY (with the remainder allocated to BIL) would be as follows:
Conservative: 40%
Moderate: 30% + (40% of the other 70%) =58%
Aggressive: 50% + (40% of the other 50%) = 70%
Returns on all 3 versions (1/1/2022 through 5/22/2025)
Conservative
Moderate
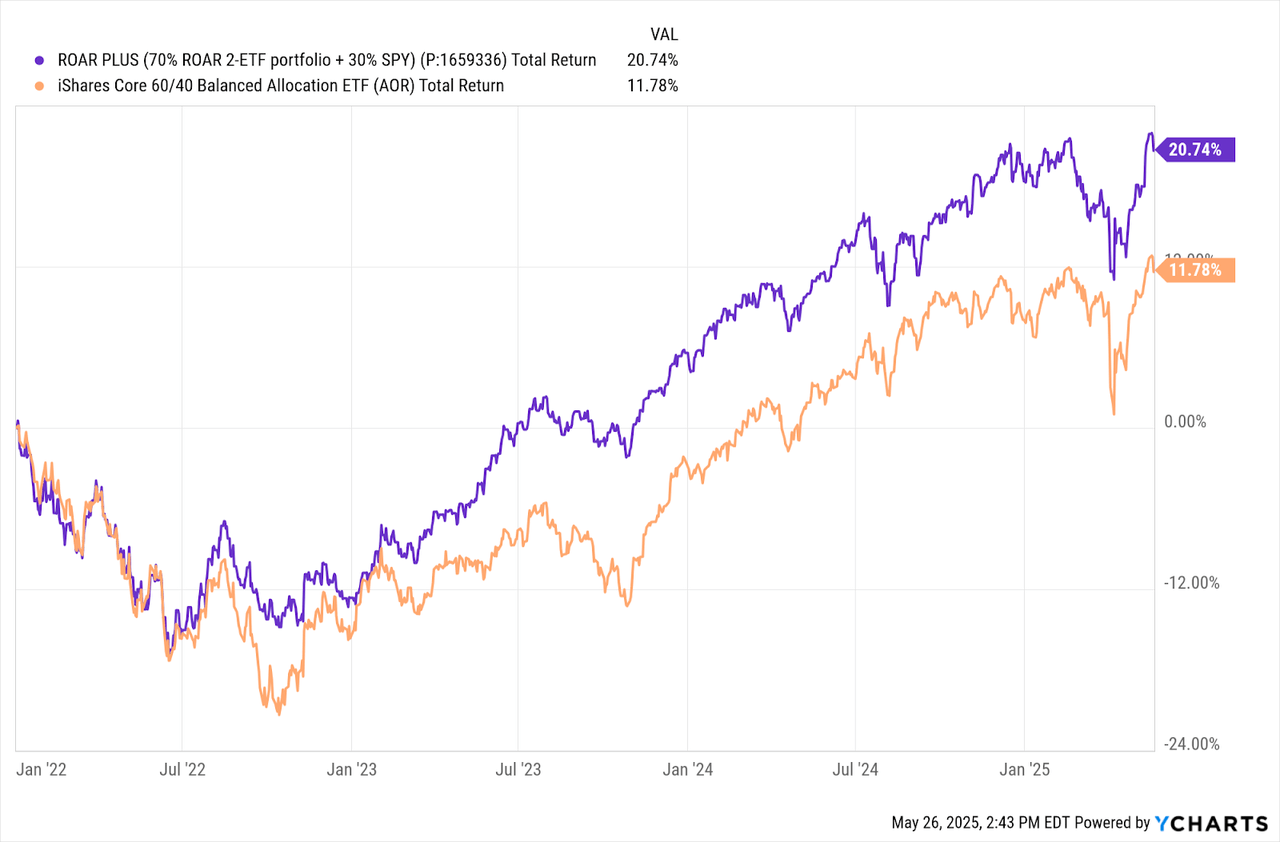
Aggressive

Finally, in order to provide some additional due diligence material for prospective club members, here is a summary table as of 5/22/2025. Here’s what you’re looking at, by column, from left to right:
The name (and symbol for ETFs) of the 3 different Sungarden Simple Portfolios. They are ranked by descending order of Calmar Ratio, which is simply the 3-year annualized return divided into the 3-year maximum drawdown. We have always felt that the Calmar Ratio is an excellent, though vastly underused statistic to help investors understand that reward/risk tradeoff that governs everything we do here.
The higher the Calmar Ratio, the more successful a strategy or security has been in generating risk-adjusted returns. Because if we’ve learned anything about investor behavior over the decades, it is that when steep losses occur, emotion can crowd out good decision-making. Our approach to dealing with that: Avoid Big Loss (ABL)!
This volatile, wide-ranging, 3-year period includes:
Much of 2022’s worst year for “asset allocation” since the 1970s
2023’s “everyone in the pool” rally
2024’s “Mag-7 stock festival”
2025’s tariff-driven spikes in both directions
Through this winding market evolution, which is still very much in flux, the 3 Sungarden Simple portfolios produced higher Calmar Ratios than all 14 of the ETF strategies shown below. You can see the annualized 3-year returns, maximum drawdowns, and annualized standard deviation of each to the right. And the far right column goes back a bit further, to the start of the Sungarden Simple Portfolio concept.

Investors should NOT take this as a complete evaluation of any investment approach, including ours. However, this analysis and explanation are provided not only to respond to that original question “what’s your performance” but also to help prospective club members to better understand what we prioritize in our investment research, as well as how we view the ongoing investing process. In our experience, some club members focus more time and energy on taking the 2-ETF structure and building out from there, while others take note of it, but prioritize the stock selection, ETF selection or option strategies that are all big parts of the experience with us.
As the club grows, we look forward to brainstorming with our members to develop as many versions of Sungarden Simple Portfolios, and our other ongoing efforts, as they wish!
Like what you're reading? Want to hear more? Try us out HERE