ROAR Score (Return Opportunity And Risk): Automated technical chart analyzer for investors
Now available for free (first 1,000 users) at ROAR.PiTrade.com

ROAR.PiTrade.com
From Sungarden Investment Publishing and PiTrade
By Rob Isbitts, Founder, Sungarden Investment Publishing
Introduction: The “Wall Street” Myth
You’ve spent years building your career. You’ve learned that success comes from discipline, high-quality data, and the ability to tune out the noise. Yet, when you look at the world of investing, it feels like a chaotic “casino” designed to keep you guessing.
Wall Street thrives on complexity. It promotes “Buy” and “Sell” ratings that are often late to the party—upgrading stocks after they’ve surged and issuing warnings only after they’ve crashed. For a bright, busy professional, this isn’t just frustrating; it’s a failure of the system. You don’t need a “hot tip” in your inbox. You need a compass.
The ROAR Score (Return Opportunity and Risk) was built to be that compass. It is a proprietary methodology born from over 30 years of professional investing experience, designed to dismantle traditional “asset allocation” myths and provide you with a clear, surgical view of market risk.
How Decades in the Trenches Led to the ROAR Score
I learned to chart stocks when I was 16 years old, in 1980. I was the only student of my late father, a DIY investor, who used graph paper and a pencil to make decisions, and kept the family from running out of money when the industry he worked in essentially vanished in the 1980s.
This was my inspiration to enter the investment business in 1986, which ultimately led to my 4-time selection as a US Top 100 Wealth Advisor by Worth Magazine, a stint as a CIO of a $3 billion investment firm, managing mutual funds, authoring investment books, and in 2011, starting my own investment firm, which my wife and I named Sungarden. Because we had moved our family to the Sunshine State (Florida) from my native Garden State (New Jersey) in 1997.
We sold that advisory practice in 2020 to semi-retire. That is now a family joke, since I’ll never retire! This began a 6-year journey to capture in an easy-to-use decision-making system what I had spent more than 100,000 hours of his life doing: charting stocks and funds.
In 2025, after several attempts to deliver my intellectual property in a form that investors of all levels could use to analyze securities and build portfolios, I caught a big break. I met Priyanka Ranjan and Harshit Khandelwal, founders of PiTrade.com. The skill sets were an ideal match, and a relatively short time later, ROAR.PiTrade.com, an innovative, intuitive, risk-management-focused investment research portal, was established.
Here’s an introduction to ROAR, why it was so important to develop, and why I am convinced it is the best legacy I can leave for this and future generations of investors. And yeah, I think Dad would be very happy with how it turned out.
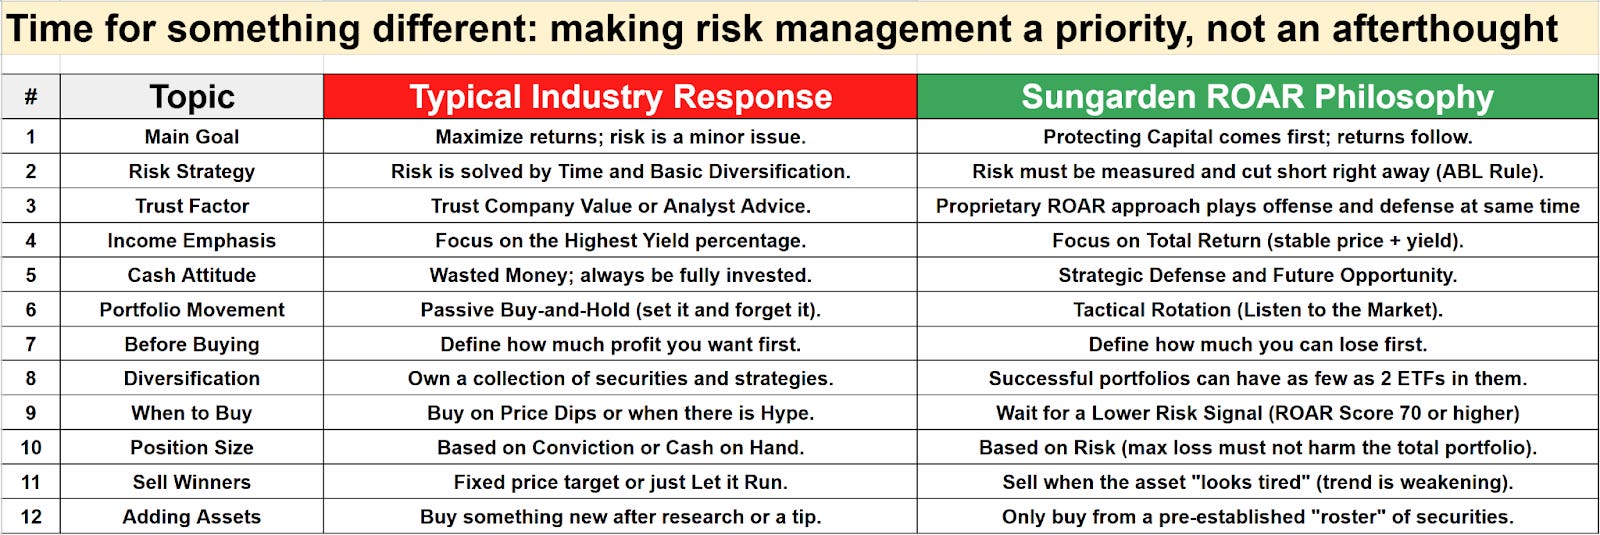
I. The Philosophy: Managing Greed and Fear
In the 1990s, I began developing the core concepts that would become the ROAR Score. My goal was simple: to create a “defense-first” framework that prioritizes capital preservation. Back in my days of providing personalized advice for high net worth families, I developed an insistence on doing everything within my power to avoid giving them back a large portion of the wealth they worked so hard to build.
High returns on your portfolio are fun and exciting. But if they are simply part of a volatile cycle, that can add stress to our already stress-filled lives. So I’ve always opted for a more consistent, lower-volatility approach to managing money. It has served me well, even if I don’t have any 50% up years to brag about.
The beauty of ROAR.PiTrade.com is that we don’t tell you what to do. Sure, we have the ability for you to choose a strategizer portfolio (mine or several others) and in a few clicks, have your account copy-traded for you. But here, you also have this innovative, easy to use research portal we’ve developed.
That allows you to take our research, add it to your own investment preferences and biases, and build whatever you want. All the time, knowing that there is a time-tested, risk-management-focused approach backing it. Is it guaranteed? Of course not. But does it increase your chances of investing success? We think so. That’s what ROAR investing is all about.
The Information Paradox
Most investors fail because they focus entirely on what they can make (Greed) while ignoring what happens if things go wrong (Fear). Traditional ratings are binary—they tell you what to buy, but they rarely tell you how much of it to own relative to your risk tolerance.
The ROAR Score changes the narrative. It moves away from arbitrary 12-month price targets and focuses on the reality of the “Next 10% Move”.
II. How the ROAR Score Works
The ROAR Score is a percentage from 0 to 100 that answers a fundamental question: “What is the probability this stock or ETF will rise 10% before it falls 10%?” Now, that is not 10% for every ETF or stock. One feature (or bug if you ask me) of modern markets is that when markets get angry or excited, they can move the price of even a sleepy stock or a bond ETF by 10% in a matter of days.
I think the best thing about the ROAR system I developed is that it treats investing as it should be: as a series of process-driven decisions, not as an ongoing case of “what should we speculate on today.” The busy, upwardly-mobile professional will realize quickly that most of Wall Street is not in the investing business. Their business is selling products. And dreams. It has always been this way. But in the post-pandemic economy, it has run amok.
For those who wish to play that game, I say, best of luck. It is not the way we do things here. We are too serious about the money we’ve already made to play games and risk giving it back.
That’s why a big part of our effort here is investor education. Teaching risk management to investors who want to learn it. And using the portal we created at ROAR.PiTrade.com as our chalkboard, so the ongoing learning experience here is always timely.
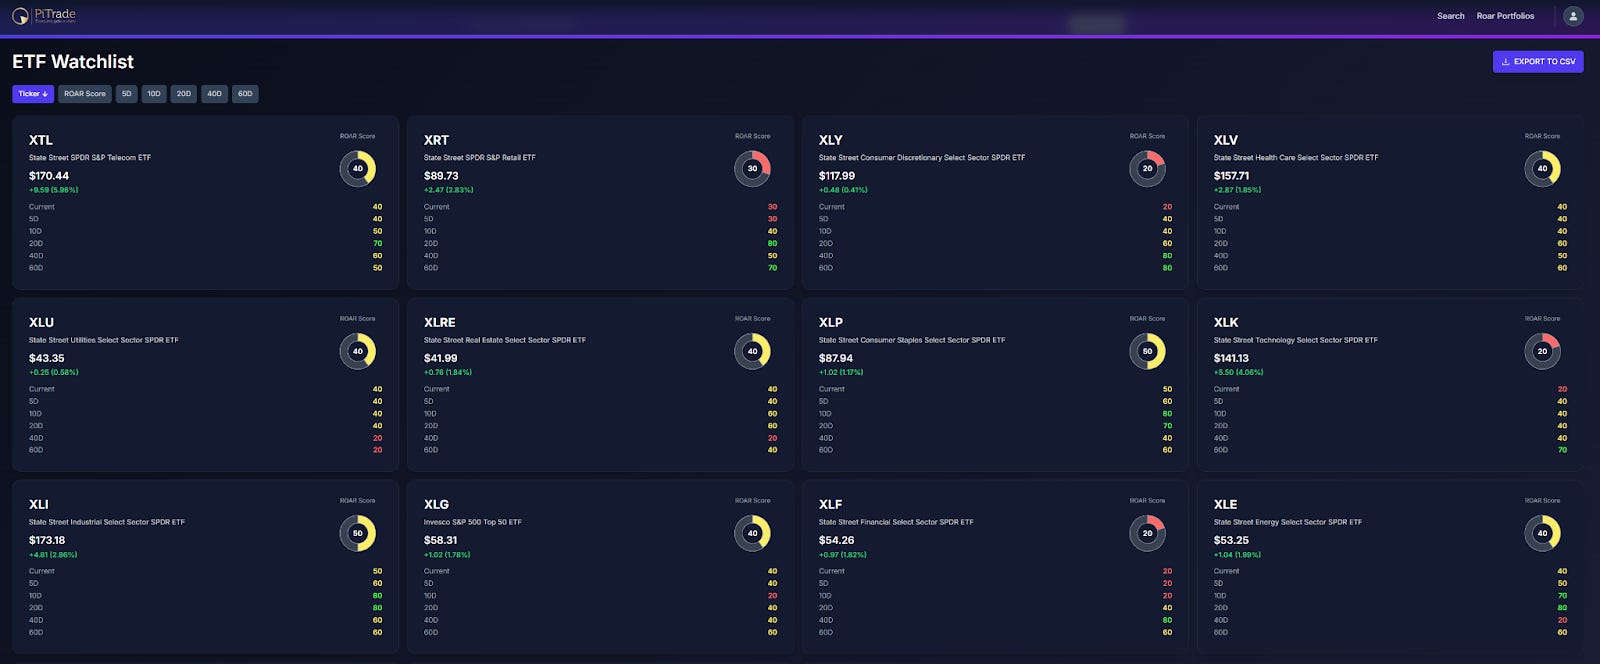
Decoding the Numbers
Scores near 70-90 (lower than normal risk): Indicate a high-conviction, favorable environment where the odds are tilted heavily in your favor. No guarantees, but lower than normal risk of major loss.
Scores near 40-60 (normal level of risk): Represent a “neutral” zone where the ETF or stock is at a decision point, without a strong signal in either direction. Sometimes, the best move is to wait.
Scores 30 and below (higher than normal risk): Signal high risk, where the probability of a double-digit drop is significantly higher than a gain. Since ETFs and stocks can quickly get “washed out,” this may also be where a security ends up on the ROAR scale shortly before it bottoms.
Why Not 0 or 100?
Scores of 0 or 100 do occur, but they are clearly at the “tails” of the ROAR spectrum. In investing, there are no certainties—only probabilities. By creating a process in which the vast majority of scores fluctuate between 10 and 90 (in increments of 10), we acknowledge that “anything can happen,” even when the odds are stacked in one direction.
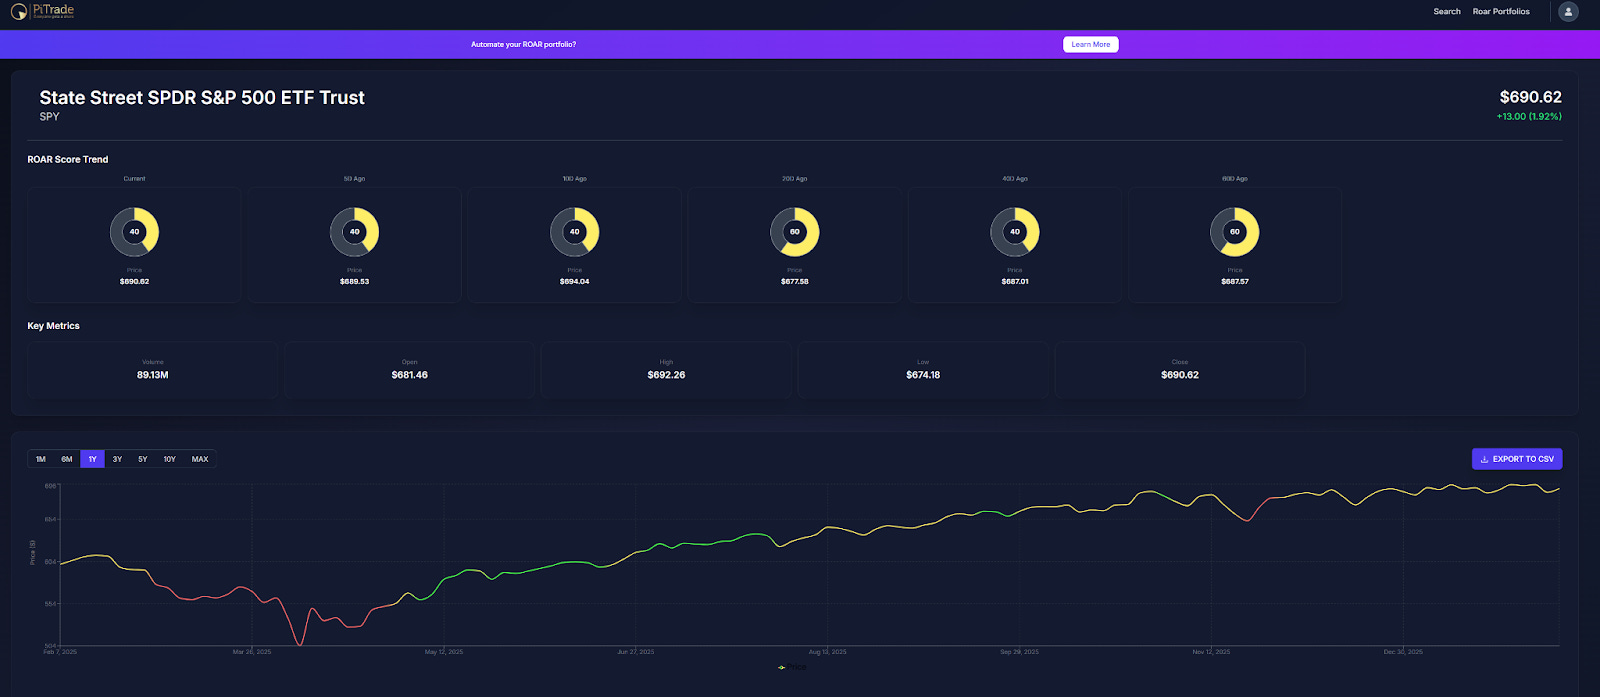
The Technical “Engine”
The score isn’t a guess. It’s an automated “chart reader” that builds on raw technical data sourced by PiTrade.com from reliable sources, and updated nightly to produce ROAR Scores for thousands of ETFs and stocks. It evaluates multiple time periods to calculate a smoothed score, whose history can be viewed at any time on the site, for each security, back to the start of 2020.
Key Differentiation: Unlike many systems that “chase” momentum, the ROAR Score has a built-in risk-management bias. The more a stock has surged recently, the lower its score may become, preventing you from “buying high” into a trend that is already exhausted.
It is important to understand that like the value of individual securities themselves, the ROAR Score is a “moving target.” New information, driven by price patterns a.k.a. Technical analysis is a constant flow of additional return opportunities and risks. Thus the name ROAR. That’s why this research is best used as a risk management tool, more so than a “buy/sell/hold” indicator.
Because I learned a long time ago that those 3 words mean virtually nothing…unless there’s context added.
Questions every investor should ask themselves before they dive into these modern markets:
What are your objectives? Put another way, how do you define “winning” as an investor? And over what time frame, or time frames?
What is your approach to the ever-present risk of financial markets in an era of instant information, algorithmic trading and indexed investing?
Are you about tracking the S&P 500 index (I am not, have never been), or simply trying to make money as consistently as possible, avoiding major drops in portfolio value (ah, that’s me!).
How much time do you want to devote to this, alongside the many other things that occupy your time?
Is ongoing self-education about investing important to you, or are you more of a “just do this for me” type at this stage of your career and life?
III. The “Straighter Line” Strategy
For the busy professional, managing a portfolio of dozens of stocks is a second full-time job. And with each passing year, I have found it is less helpful than the year before. Because markets don’t work like they used to. They are much more “correlated” to each other. Risk-on/risk-off has invaded the territory formerly known as traditional diversification.
That’s why I created the 2-ETF Pair model. Because as I’ve written and documented over the past several years in my ETFYourself.com weekly letter, I firmly believe that for many investors, perhaps the majority of them, a simple 2-ETF mix, with subtle, ongoing adjustments to that mix, can be the core of their portfolio. The rest is just building around it, to your personal preferences. And I’m not just saying that. I have the evidence.
The SPY-BIL Model
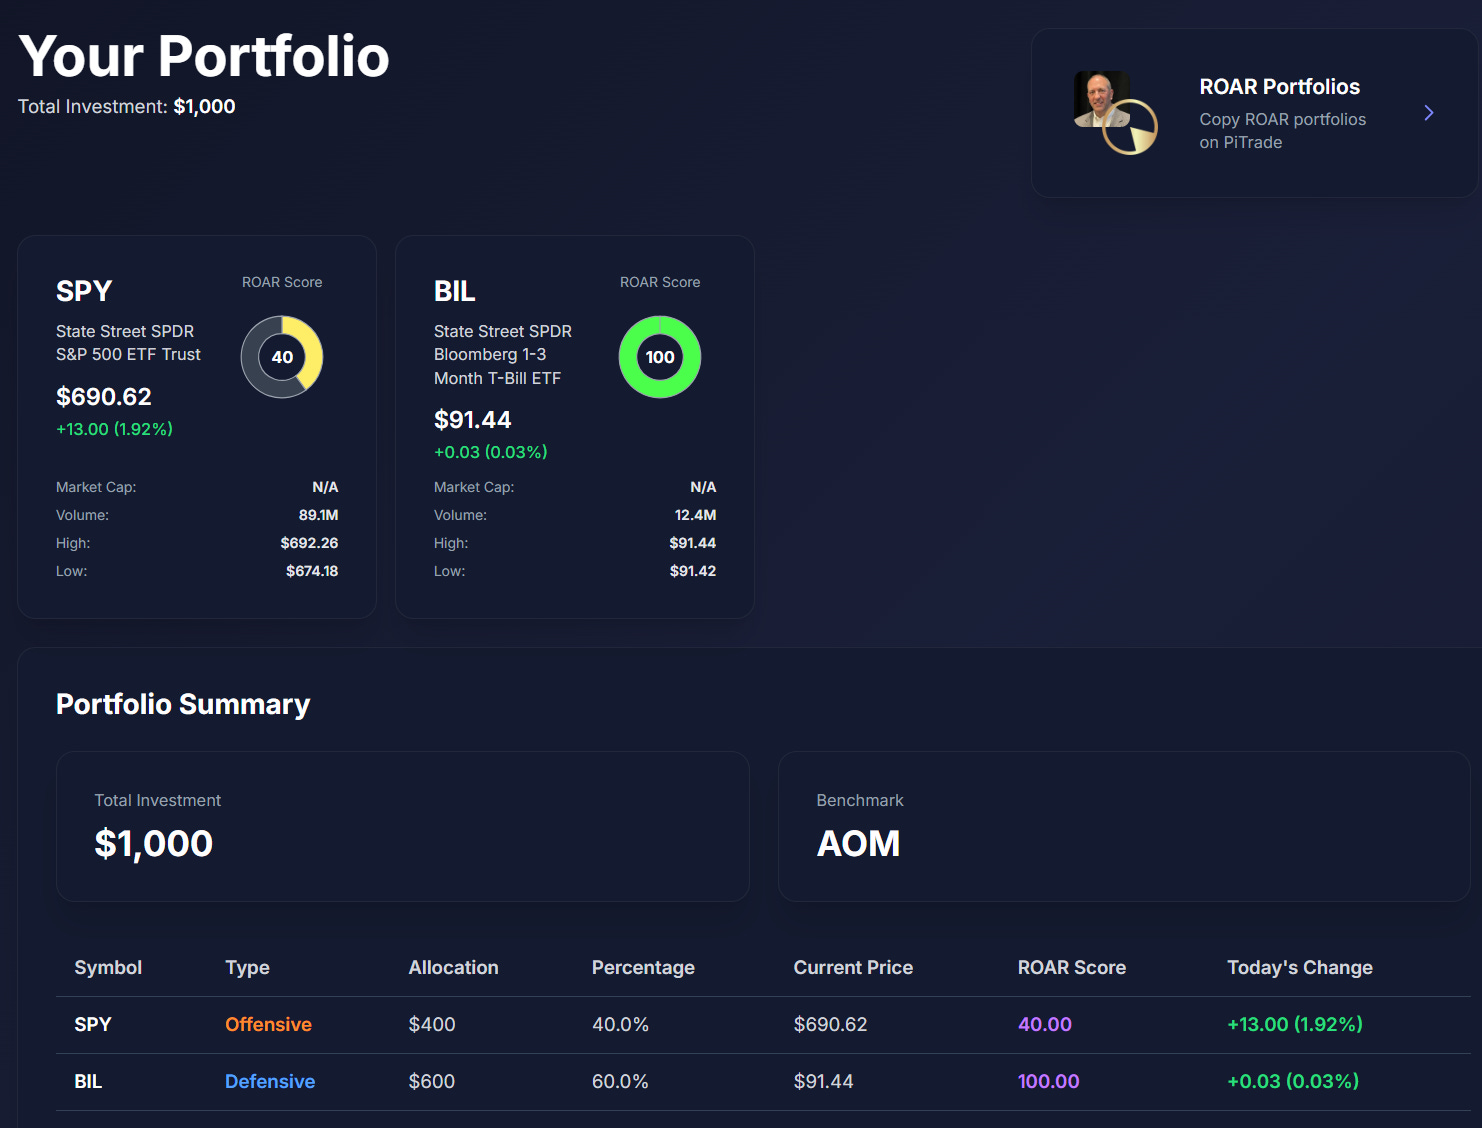
This strategy acts as the “training wheels” of the market. You simply allocate your capital between two assets:
SPY (Offense): The S&P 500 Index ETF.
BIL (Defense): The 1-3 Month Treasury Bill ETF.
The “Volume Knob” Execution
You use the ROAR Score as a dial.
When the ROAR is high (e.g., 70), you turn up the volume on SPY (e.g., 70% growth).
When the ROAR is low (e.g., 20), you slide to the safety of BIL (e.g., 80% safety).
In 2022—one of the worst years for stocks and bonds in decades—this “de-risking” discipline allowed me to protect my own capital while the broader market slid.
Here’s a chart of how this model performed. This is past performance and it is hypothetical. But it uses the ROAR discipline described in this paper.
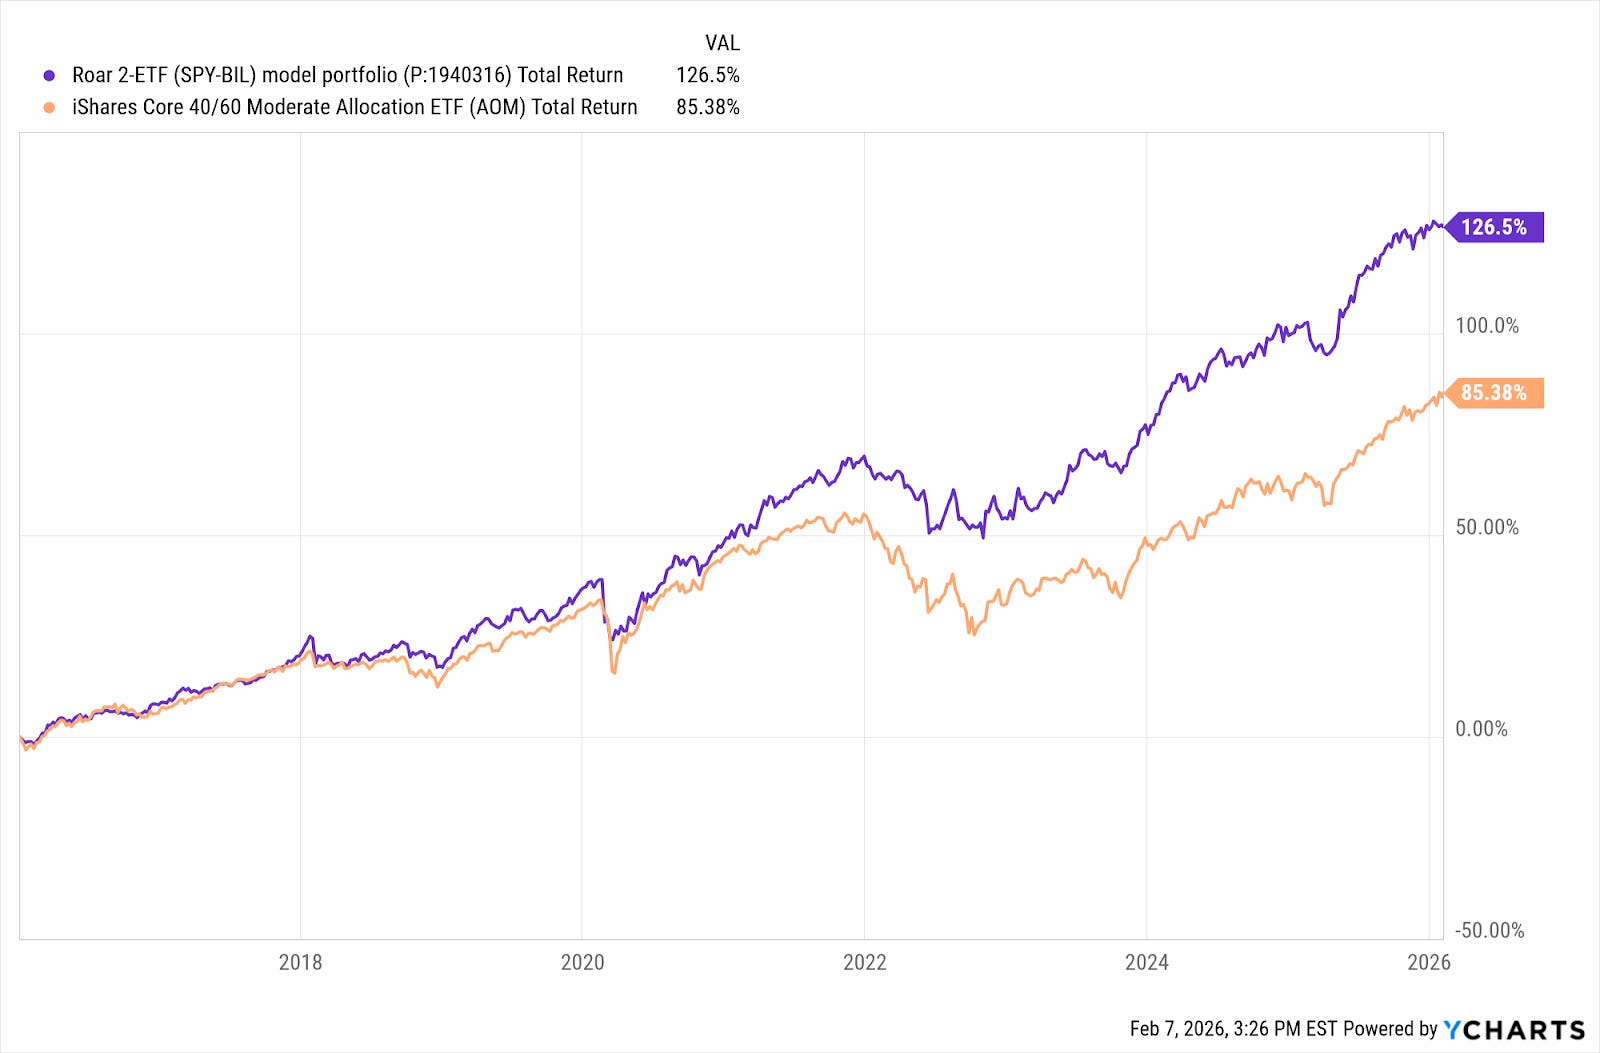
Here’s a table comparing this simple, 2-ETF portfolio to a traditional “moderate allocation” mix, represented by ETF ticker AOM, which allocates 40% to stocks and 60% to bonds at all times. AOM is an example of static asset allocation, whereas ROAR represents active, tactical allocation. Even among just 2 securities representing stocks and cash (or offense and defense, as we call them here), the difference is pretty dramatic, I think.
Above you see some bottom-line statistics from the 5 years ending 2/5/26. Here, we’re comparing the 2-ETF portfolio to the S&P 500 itself, to see how blending defense with offense impacts return and risk.
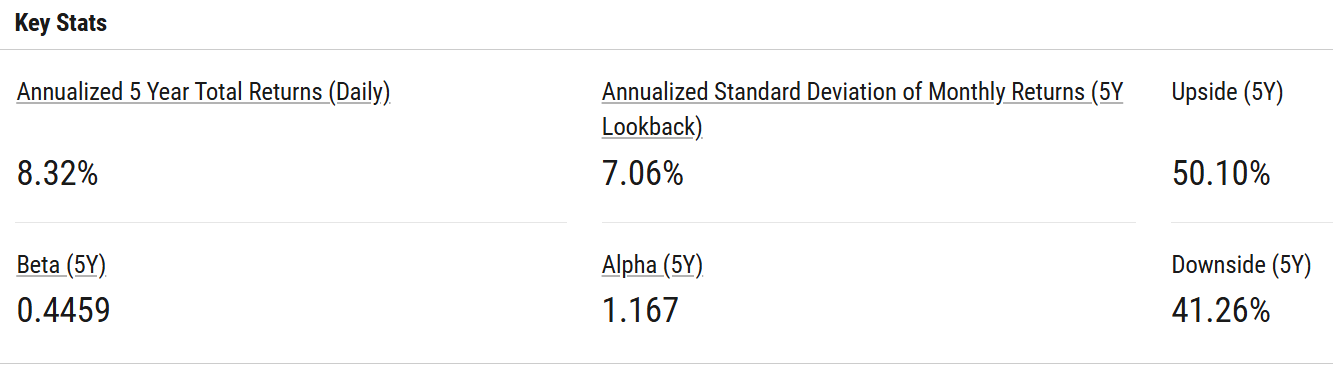
The 2-ETF portfolio with ROAR driving the bus produced an annualized return of more than 8%. More importantly to risk-conscious investors, its “standard deviation” , a popular measure of how variable returns are, is only 7%, a fraction of the S&P 500’s.
A beta of 0.45 means that the 2-ETF portfolio was less than half as volatile as the S&P 500, and its positive alpha implies that the active approach used added value, when we account for risk. High returns are great, but at what cost do we pursue them? ROAR is all about keeping risk manageable, THEN trying to make as much as we can.
Finally, the Upside/Downside indicates that the 2-ETF portfolio earned about half of the S&P 500’s return during up market cycles, but really clamped down in market declines, enduring just 41% of the S&P 500’s declines.
This happened to be an extremely strong 5-year period for the S&P 500. That’s why identifying and analyzing risk now, as opposed to after one is in the midst of a bear market, is so critical. This 2-ETF portfolio, like the ROAR Score itself, shows us that it is “ready for bear,” so to speak.
IV. Conclusion: Time to Get Your Slice of the Pi
Investment success shouldn’t eat into your weekend. By spending just two minutes once a week (you choose the day) checking the ROAR Score, you can adjust your “dial” and go live your life, knowing your capital is managed with professional-grade discipline. And if once a month, or some other time interval works better for you, do that instead. This is YOUR investment process. And it doesn’t have to be complicated.
Once you have the basics of the 2-ETF SPY-BIL portfolio down, you can use ROAR.PiTrade.com to create more 2-ETF portfolios (or use ours), or extend your research as deep into the platform as you like. And with our regular live sessions (coming soon), you’ll have the opportunity to interact with me and other PiTrade investors and strategizers, to share our collective “best practices” for using the site.
And, if outsourcing your investing is part of your plan, that’s easy to set up and maintain at PiTrade.com.
It’s time to stop guessing and start ROARing.
Appendix: (this paper in FAQ Format)
About the ROAR Score and ROAR-based investing
I. Core Philosophy & Purpose
1. What does ROAR actually stand for? ROAR is an acronym for Return Opportunity and Risk. It is a proprietary methodology developed by Rob Isbitts based on over 100,000 hours of professional investing experience to reduce emotional decision-making.
2. Why was the ROAR Score created? It was designed to dismantle traditional “asset allocation” myths that rely on stagnant, “buy-and-hold” models. Instead, it serves as a flexible, adaptive tool that syncs with modern, volatile markets.
3. Is this a “Buy” or “Sell” signal? No. It is a research data point rather than a binary “buy/sell” system. It is intended to help DIY investors determine how much of a security to own at any given point in time.
4. How does ROAR help with “emotional” investing? By focusing on a single number rooted in data, it helps investors move away from the “greed and fear” cycles driven by daily news headlines.
5. Why focus on a “10% move” instead of a target price? Traditional price targets often have arbitrary deadlines. ROAR focuses on the next consequential change in price—specifically, whether a 10% move up or down is more likely to happen first.
II. Decoding the Numbers (0-100)
6. What does a ROAR Score specifically mean? The score represents the probability of a specific outcome. For example, a ROAR Score of 30 signifies that a security has a 30% chance of rising 10% before it falls 10%.
7. Why do scores rarely hit 0 or 100? In investing, zero and “non-zero” are different things. A score of 100 would imply zero risk, and a score of 0 would imply zero opportunity—neither of which is realistic in modern markets. Typically, scores fall between 10 and 80.
8. What does a score of 70 tell me? A score of 70 implies that the “weight of the evidence” suggests a 70% chance of a 10% move upward before a 10% move downward.
9. What is a “Black Hole” score? Scores under 20 indicate a very low probability (20% or less) of a 10% rally occurring before a 10% drop. These are often considered a “black hole” where risk significantly outweighs potential reward.
10. How does the “favorite vs. longshot” analogy work? Just like horse racing, the “favorite” (high ROAR score) wins often, but “longshots” (low ROAR scores) do win sometimes. Every stock has a chance to gain, but ROAR identifies where the odds are longest.
III. Methodology & Data
11. Where does the data for the ROAR Score come from? Scores are generated by building on existing Barchart technical data and adding a proprietary weighting process that translates price direction, strength, and trend into a single percentage.
12. Which moving averages does the system use? To avoid relying on a single timeframe, the methodology uses three different averages: 20-day, 50-day, and 150-day.
13. How does ROAR handle stocks that have already surged? ROAR has a built-in risk-management bias. The more a stock has gone up, the less its ROAR score will be (all else being equal), because the risk required to chase those gains has become disproportionately high.
14. How often are the scores updated? The proprietary scores are updated weekly for any stock or ETF on the platform to reflect current market dynamics.
IV. The 2-ETF Strategy
15. What is the “2-ETF Strategy”? This is a simplified “defense-first” model using only two assets: SPY (S&P 500) for market growth and BIL (1-3 Month T-Bills) for safety.
16. How do I use the score for “Position Sizing”? The higher the ROAR score, the higher the position size (weighting) that security should have in your portfolio.
17. What are BIL and SPY?
SPY: Tracks the S&P 500 index, providing exposure to a broad range of large-cap U.S. stocks.
BIL: Focuses on zero-coupon U.S. Treasury Bills with less than three months to maturity, offering a low-risk safe haven.
18. How did this model perform in 2022? While 2022 was a historically poor year for traditional stocks and bonds, this tactical model allowed for principal preservation by shifting to BIL as risk increased.
V. Practical Routine
19. Is this for day traders or long-term investors? It is for DIY investors who want a clear assessment of the current risk environment to make less emotional decisions over different market cycles.
20. What is the best way to get started? Start by identifying the current ROAR score for the S&P 500 ($SPX). The lower the number, the more risk you are taking to pursue the same dollar of profit.