

Is your favorite stock more likely to go up 10% or down 10% from here? Most investors can’t answer that—they just “hope” for the best. After 45 years of reading charts and managing money for high-net-worth families, I’ve decided to bottle my process into a tool that gives you a clear, objective answer. We call it ROAR, and it’s officially live. (Click HERE to see the live example above)
Here is what you need to know about the platform:
Decades of Experience in One Number: ROAR distills over 130,000 hours of investment experience and 45 years of charting into a single score for any U.S. stock or ETF.
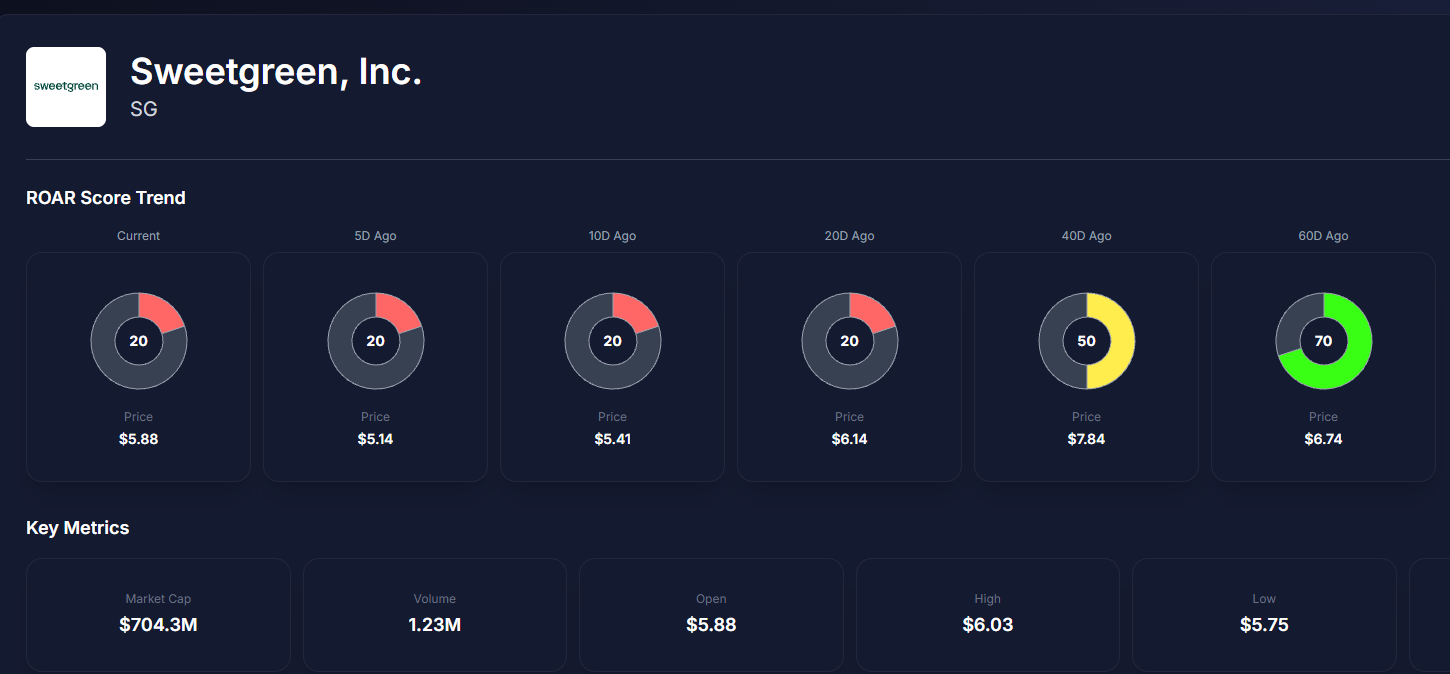
A “Risk-First” Approach: Instead of traditional “Buy/Hold/Sell” ratings, ROAR estimates the probability of a 10% upward move versus a 10% downward move to determine which is likely to occur first.
The Scoring System:
70–90 (Green): Below-average risk; a signal for higher confidence in positioning.
40–60 (Yellow): A balanced or neutral risk environment where there is no immediate rush.
30 or below (Red): Higher-than-normal risk, serving as a warning to manage position sizing or risk.
Dynamic Portfolio Building: Use the portfolio tool to pair offense with defense and watch how the ROAR score automatically adjusts your allocation to manage volatility.
Transparent History: You can look back through 10 years of historical signals for any ticker to see how the ROAR score navigated previous market cycles.
Custom Watchlists: Instantly analyze the S&P Top 20, specific sectors, or your own list of tickers.
Free for Early Adopters: The research portal is currently free to use for those who sign up with their email.
Ready to see the ROAR score for your portfolio? Visit ROAR.PiTrade.com.