
Taking on the Stock Market Bully
Risk managed investing is working, and it is getting easier to DIY all the time

Anyone else tired? I sure am! Maybe it’s from this:
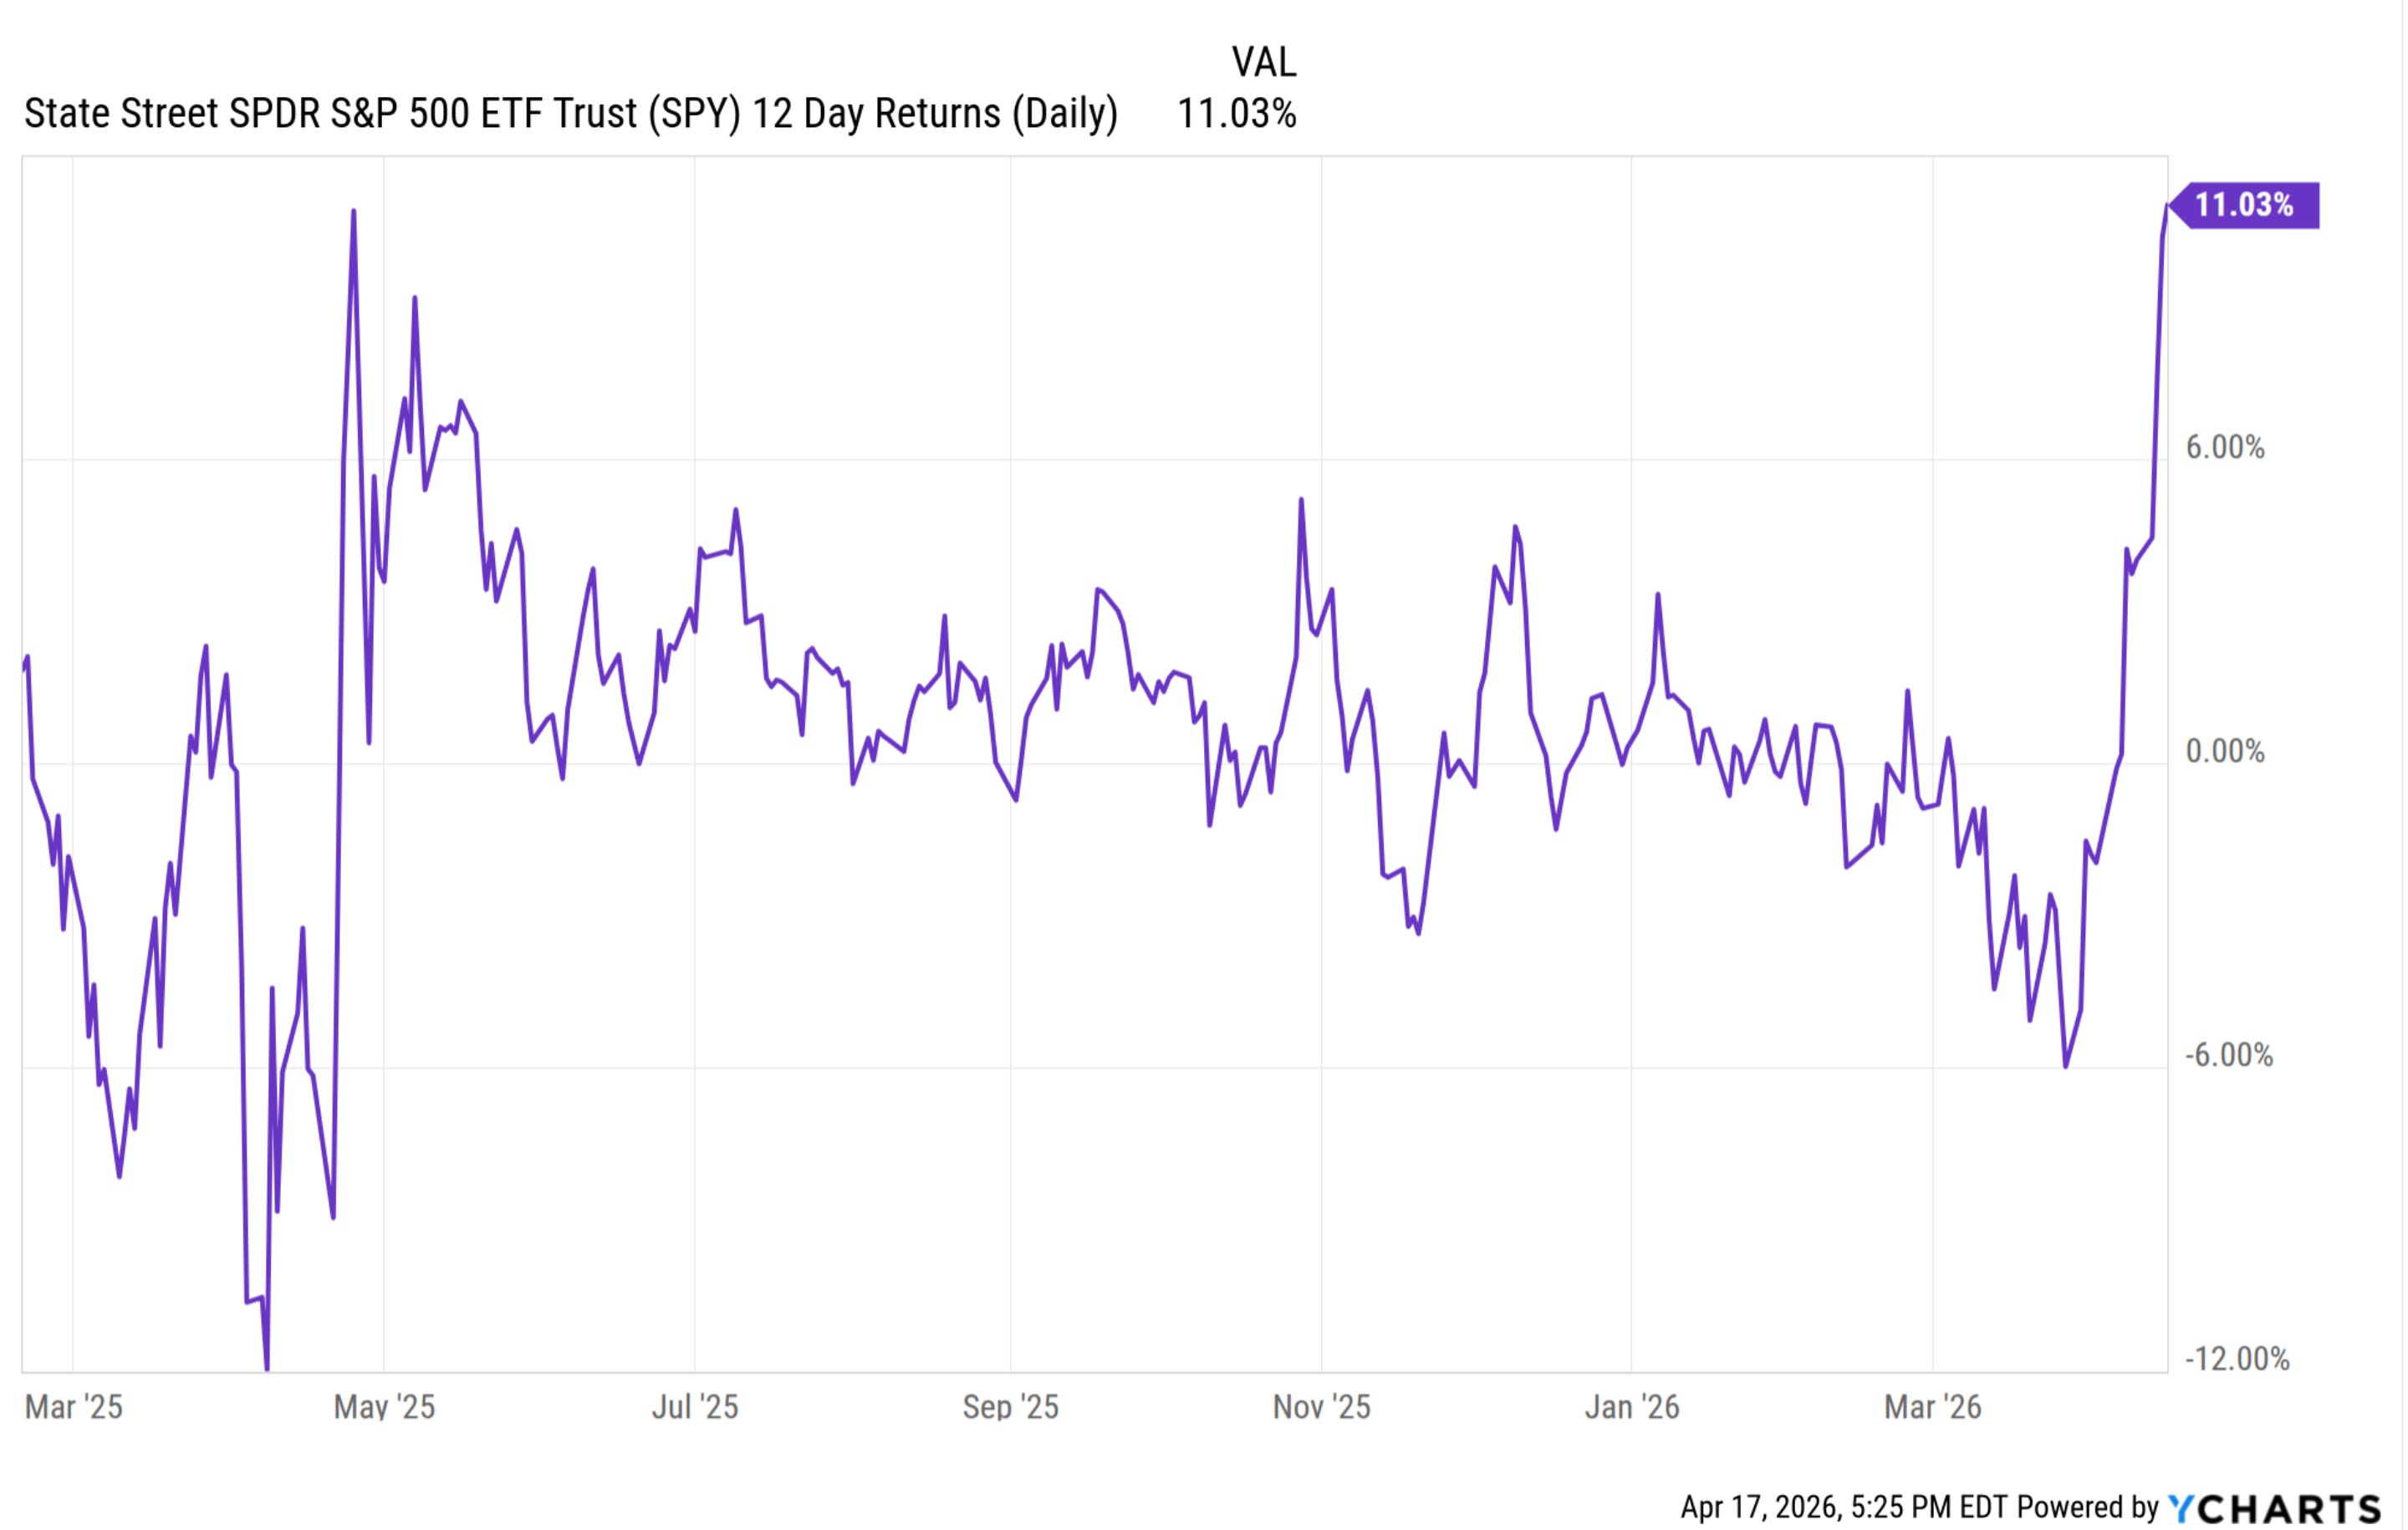
That’s a chart of 12-day returns of the S&P 500 ETF (SPY) since March of last year.
Questions:
Why go back to that point?
And what does it mean for the coming weeks and months for investors?
More to the bottom-line, what am I doing about it?