
The 3s Report
From timely to timeless, the 3 most important points we can make about stocks, bonds, ETFs, markets and investing...updated weekly


ROAR Score weekly update
Our "Reward Opportunity and Risk" (ROAR) score remains at 40.
This means a 2-ETF portfolio that can only be allocated to SPY and BIL would be 40% SPY and 60% BIL.
In case you missed it, we have expanded the series of ROAR "simple" portfolios from the original SPY/BIL (nearly 3 year record) by adding 3 more. You can check them all out, with allocations updated on Tuesdays, in the shared research deck that is also clickable for Investment Group subscribers from the Sungarden YARP Portfolio site on Seeking Alpha. Not subscribed yet?
3 Quick Thoughts on markets
I'll put it this way: if you think that the nature of "what works" in investing hasn't changed dramatically since the pandemic, you're not paying attention.
Every day across my screens, I see evidence of this. Markets increasingly reward shorter-term holding periods than longer ones. And a "risk on vs. risk off" mentality is no longer just for meme stock traders. Because it impacts all of us.
This is the driving force for me as an investor as we prepare to close the books on 2024 and prepare for the new year.
3 ETF (or index) charts I’m watching
Crypto's next big move
Is it me, or did the Bitcoin et. al. story seem like it stopped being sexy when it hit $100k? There is early chart evidence of a what we'd call "exhaustion," but if anything can break with charting tradition, it is this asset class.

China stocks will not go quietly
This ETF tracks the major Chinese-based companies, but traded on the Hong Kong stock exchange. This would be a bigtime comeback story, but until proven otherwise, it is just a mighty bounce.

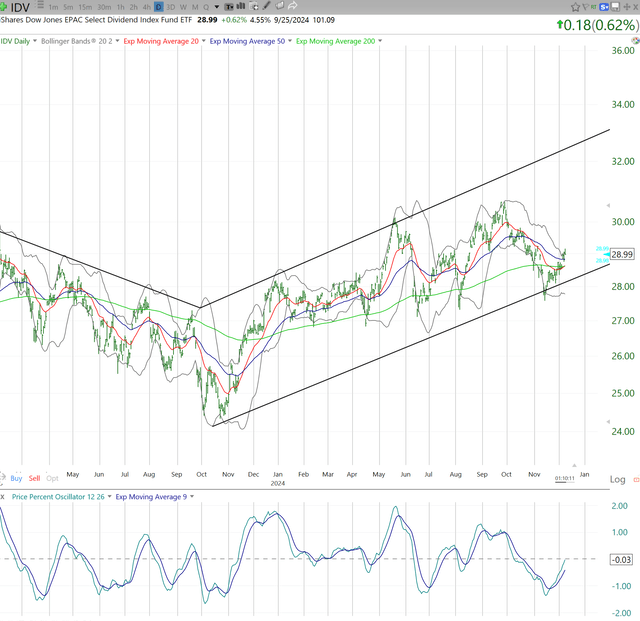
Watch this (international) space
Mark down today as the day I devoted 2 of 3 ETF spaces in The 3s Report to non-US stocks. This could become a "thing" as I am seeing a ton of intriguing dividend stocks emerge outside of my home country. The comeback of international vs. US has been rumored for years. But this is showing at least strong 10% upside potential, for starters.
3 stock charts I’m watching
Why I'm using more ETFs and fewer stocks lately
Because way too many dividend stocks look like this one. That's nearly a 100% trading range, in place like clockwork since 2013. That means the chart's "potential destination" on the downside is a 50% loss. Put another way, this has been one of my best performers this year, but it is too easy to fall into the "buy and hold" camp and not realize that the stock is where it peaked...7 year ago! If it yielded double its actual 3.3% dividend rate, I might be more patient. But it doesn't. Again, this is not an isolated case, just one of many examples.

Under its skis
This is a recent addition to the Sungarden YARP portfolio, and it is also the first time I've ever owned it. It just makes it over the bar fundamentally, and it is not what I'd call a "blue chip" REIT. However, there's at least a shot that it is bottoming long-term, and I've circled the 20-week moving average which has not looked this good in years. And the PPO "confirms" that potential. This will be a modest position size for a while, but hopefully the sharp contrast with the IP chart above allows you to see what I see, and why. There are not enough of these out there, which is another reason I am more ETF-friendly when it comes to pursuing portfolio income.

Why every investor should respect technical analysis
You don't have to love charting as much as I do, or my late father before me (for those not familiar, he taught me this when it was considered akin to voodoo, in 1980, a great lifelong gift). But to deny that it plays a MAJOR role in why prices move as they do is a huge mistake. Frankly, an arrogant one.
Target cratered not long ago on earnings, and not too long after I bought it. There are occasions where a stock might be sellable to me after such an event. But not this one. As I wrote on Seeking Alpha at the time, the bounce potential was strong, because as this chart shows, it fell right to the darn trend line! With Monday's up move, it is now 15% up from where it fell to. In 12 trading days. Out of the woods? No way. But a reason to understand what so much "big money" does? Certainly.

Final thoughts for now
We hope those of you who joined us for Monday's series premiere...OK, a bit over-dramatic there...of our weekly investment education series found it productive. Again, we are recording my introduction to each session (about 10 minutes weekly) to have an updated "video library" people can refer back to.
Also, some pretty big news regarding the Yield At a Reasonable Price (YARP™) dividend investing factor, my intellectual property that prompted the launch of the Seeking Alpha investing group. Syntax Indexes, the folks that worked with me to test the original YARP methodology several years ago, have just supplied me with an updated data set. That's a fancy way of saying that we are on the way to having a contemporary "back test" of using YARP for stock selection and portfolio-building purposes. More on this very soon.