From timely to timeless, the 3 most important points we can make about stocks, bonds, ETFs, markets and investing...updated weekly
ROAR Score weekly update
Our "Reward Opportunity and Risk" (ROAR) score remains at 40 for the fourth straight week.
This means a 2-ETF portfolio that can only be allocated to SPY and BIL would be 40% SPY and 60% BIL.
I continue to see a lack of market "breadth" but ROAR is only concerned with SPY and BIL. And for now, SPY is hanging in.
3 Quick Thoughts on markets
Christmas Day and New Year's Day falling on Wednesdays make this week and next very unreliable for investment direction. However, a longer-term outlook I conducted recently gives a hint as to what may await in the New Year.
I charted all of the roughly 500 S&P stocks, and asked myself a simple question for each: "does this stock indicate a greater likelihood of going up than down over the next 6-12 months? I was able to answer "yes" for only 21 of them. So, 96% of the index components are what I'd consider weak or inconclusive at this point.
That can certainly reverse, but I think it indicates 2 things: how high market-wide risk is, and the possibility that the S&P 500 and Nasdaq 100 indexes might not reflect it for a bit longer. Because among the 21 "yes" stocks were 5 of the "Magnificent 7." Go figure. "Year 2000 called, and it wants its 9-week rip higher to start the year back?"
3 ETF (or index) charts I’m watching
What I truly enjoy about my chart-driven approach to modern markets is that different stocks and ETFs tend to show the same type of patterns over and over again. So, I can increase my "batting average" and odds of success by "buying good charts and selling bad ones," without losing sleep over things like "what will the Fed do" and what regulations will change and impact my stocks' profit margins. The charts net so much of that out. Unless it is Bitcoin, which is its own beast and not quite as reliable chart-wise. But for the record, this looks weak.
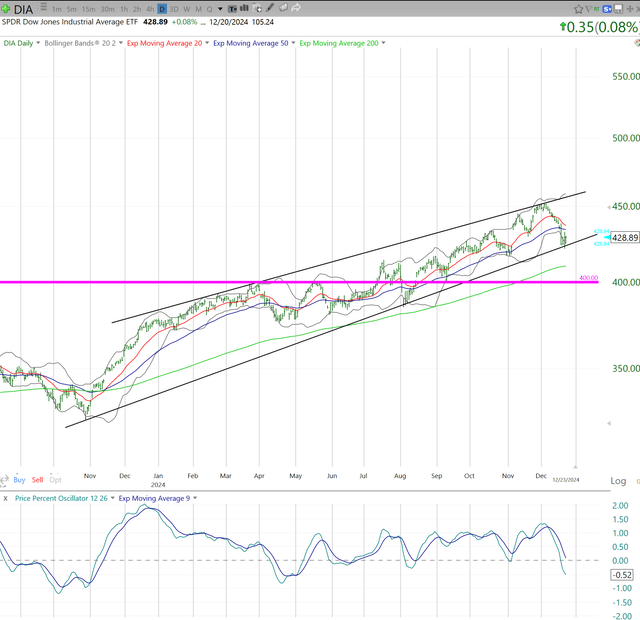
File this away for future use. If the Dow Industrials step down another 4-5% from here, it will either be in sync with a broader market decline, or just as likely, the final spirited run higher in the Nasdaq. The latter is a la early 2000.
The stock market's biggest threat? The bond market! 10-year yield is at 4.6%. 4.75% would upset some folks, and 5% might be the dagger. That said, it might be the perfect "excuse" for most stocks to roll over, while the Mag-7 keep right on chugging. Like in early 2000.
3 stock charts I’m watching
Google's 3-year annualized return is around 11%, which is near the bottom of its historical range. Is that telling us it is "cheap" here, or is the long cycle for these giant companies nearing an end? 2025 should answer that question.
I don't follow this one, but it has the look of a potential up-mover in a market thin on those. I ran my study using monthly price charts like this one (GOOG above is a weekly chart). This type of long-term "volatile leading to nowhere" is something I'm looking for more and more. Because even if the Mag-7 continue to carry everything else, at some point the market is going to reward stocks that have grown earnings and perhaps dividends, yet whose prices have netted nothing for years.
I wrote this one up last week in Seeking Alpha. And I found out that many investors defend it like it is their first-born child. This chart screams "watch out" but I saw an unusually high number of comments that essentially said, "because you don't like it," I'm buying more of it. I don't even remember 5th grade, but that type of sentiment, when I see it this frequently, and see charts like this, as akin to the proverbial "taxi driver giving stock tips" that characterized the late stages of the dot-com bubble. Might work out, but I'll let someone else take the risk on charts like this. I'm a "singles hitter," and I hate striking out.
Final thoughts for now
2025 is going to be volatile. "Way to go out on a limb there, Rob." But what is not yet clear, but should be during January-February, is in what order that volatility goes. As noted in my 2025 S&P 500 forecast, I'm allowing for a giant range of 6,800 to 4,000, with a lower market by year-end. Take that with a grain of salt. Because the true indicator is not another prediction, but what the market is telling us. And more importantly, how we react.
For me, that continues to be fewer stocks, more yield ETFs, more T-bill exposure and a key role (despite its small size) of my S&P 500 put/call owning combination. My path forward is to account for nearly anything, then pivot as that market message gets louder and clearer. And I think that will happen in early part of 2025. Stay tuned.


