


Sungarden Media Notes!
I had an absolute blast interviewing a panel of sharp next-generation analysts for Seeking Alpha's Investing Experts Podcast. We think this is something we can do regularly, so let us know what you think!
Here's a link to my debut article for FX Empire. I decided to take them up when they reached out because I truly think there's something special going on there. Follow me and get to know this emerging publishing platform. There is A LOT more to come soon.
My weekly Barchart column is here. Lately, my work here is essentially an addendum to this weekly 3s Report, in that I choose 3 stocks, chart them, and write about them.
My Seeking Alpha articles continue apace, with more than 600 published since I started contributing there just under 3 years ago.
And of course, our prime location for in-depth insight and my personal portfolio moves is through Sungarden Investors Club.
ROAR Score weekly update
Our "Reward Opportunity and Risk" (ROAR) score remains at 40 for the 10th straight week. That's a new record, folks. In the 3 1/2 years I've been weekly publishing this creation of mine, ROAR, this is the first time it has remained in place for 10 consecutive Tuesday readings.
This means a 2-ETF portfolio that can only be allocated to SPY and BIL would now be 40% SPY and 60% BIL.
I think there's a very good set of reasons for this status quo of "historic" proportions. More on that below. And no, this does not make me more of a buy-and-hold investor! Its just an indicator, but one that has served our members at Sungarden Investors Club quite well. Because it partakes in up markets, but clamps down when times get tough.
3 Quick Thoughts on markets
This is the heart of summer, and the market is acting like it. How does an indicator like ROAR break a longevity record? It's a combination of summer slumber, massive confusion about the tariff outcome and Fed policy, but most of all, the continued surge in investing assets. A reminder from us market technicians: markets go up and down due to buying and selling pressure. Media and pundits just try to explain it after the fact.
That 40 ROAR Score reflects the counter-balancing effects of several things: stock market strength, but historically high valuation and speculation. And, the continued attractiveness of T-bills at more than 4% out to 6 months. Still!
The reason we introduced a more "moderate risk" ROAR Score in addition to the main "conservative risk" one I quote here weekly is that not everyone is as much a "chicken-shxt" investor as I am. So it makes sense that for folks with a higher tolerance for risk might have a 70% allocation to SPY and 30% to BIL here in mid-summer. As a reminder, the moderate 2-ETF portfolio automatically starts with 50% in SPY, and applies the ROAR Score (40, still) to the other half. So, 50%+ (40% of the other 50%) is 70 in SPY, the rest in BIL.
3 ETF (or index) charts I’m watching
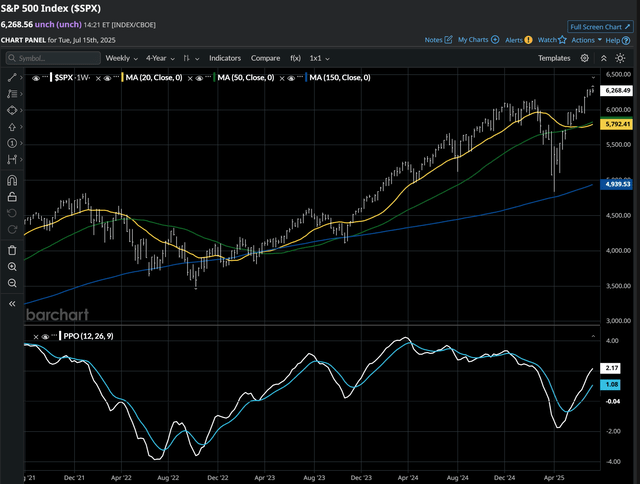
Here's the main chart I watch to ultimately post the ROAR Score each week. What do I see? Steady advance, but the length of that rising 20-day moving average (in yellow) is a risk sign in itself. Trees don't grow to the sky. But there's no obvious catalyst that would break this trend just yet. The bottom part of the chart (PPO indicator) tells me that there is a bit of a "topping" thing going on. But this is a daily chart, and that time frame can be "whippy." So this is a solid market move, but its biggest risk is itself, so to speak.
Here's that same S&P 500, but now a weekly chart below. This moves more slowly, and I can make a case for that PPO indicator to get to its typical high water mark, around 3.50 to 4.00. And the 20-week moving average in yellow is, shall we say, comfortable in its own skin, for now.
A lot of things factor into the ROAR Score. Some are part of the evaluation process every week, and some become important at certain periods of time. This is the 30-year US Treasury bond and it looks like it is about to cause trouble for stocks. It crossed above 5% today, and while that's not even its high for this year, it is pretty darn elevated. And it appears to be quite capable of moving higher, based on the PPO in the bottom section of the chart.
Would a 5.50% yield on 30-year US government paper crush the stock market? And if so, would it be the whole market, or might mega cap tech continue to hang in better than the rest? My best guess is in the last section below.

3 stock charts I’m watching
Nvidia (NVDA)'s weekly chart looks a lot like that of the S&P 500, except that its price at the top has moved faster and stronger. It sets new highs regularly. This is a positive thing for the market, at least to the extent that the few giant stocks cover for the rest.

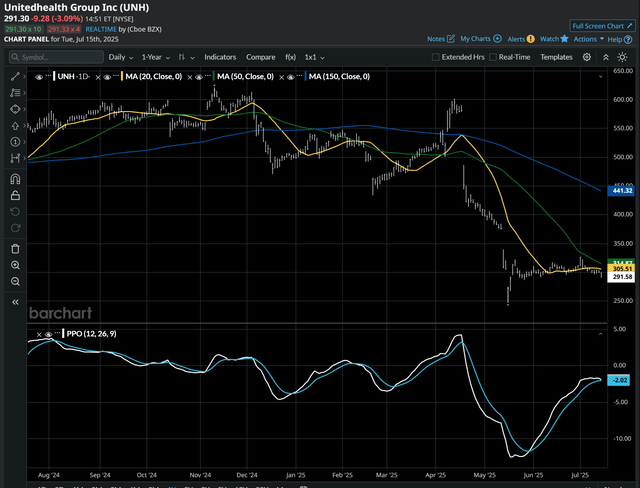
OK, tell me again why I should buy this stock? My articles on Seeking Alpha this year on United Healthcare (UNH) drew as much "dung-throwing" at me by commenters as any I can remember. They were all explaining why this stock was a screaming buy...at $350, then $300. Maybe it will report earnings that get everyone excited again. But this chart tells me that trying to play hero here is not in my best interest.
Boeing (BA) is on the move again, and is essentially telling its Dow Industrials buddy UNH "hey, you want to see how to recover as a contrarian stock position, watch me!"
This is one that is currently in my "tactical" stock portfolio. But I'm thinking it has a chance to be a rare "trifecta" in that it could also be a candidate for my long-term contrarian portfolio, and even be a stock I'd collar. We'll see. This is a monthly chart going back 20 years, and I like what's starting to form here.

Final thoughts for now
I am a risk manager, which means I am always playing offense and defense at the same time. So a market like this is both fascinating and opportunity-filled.
My best guess is that this summer's lazy, not so volatile, "burger at the beach" pace continues a bit longer. It might be early August or some time in September before the cracks that have formed will burst open. I think that trouble is out there, but I'm happy to be on this ride until it stops. Because my ROAR score-driven process, my option collar approach, bond ladders and trading process all have me set up to survive even a sudden drop that doesn't soon recover.
This is what Sungarden is all about. Anyone can throw out stock picks. But risk management, portfolio management, and learning from decades of experience? That's what we are about. Or, to put it another way, I've made a lot of mistakes...so maybe you don't have to, since I've learned a lot from them, and created a process around it.