The 3's Report
From timely to timeless, the 3 most important points we can make about stocks, bonds, ETFs, markets and investing...updated weekly

ALL SUBSCRIBERS (full and ETF-only subscription levels): the weekly technical scores for ETFs have been updated in the shared research deck.
JOIN US LIVE
As Rob Isbitts unveils the new YARP dividend portfolio subscriber dashboard!
The Yield At a Reasonable Price (YARP) portfolio is a different way to create and manage a portfolio of dividend stocks. This trademarked process is the culmination of Rob’s 30+ years of professional investing. Through our subscription service, investors learn how to scout for quality stocks with yield, analyze and rank them, and determine which ones to own and when. This is Rob’s personal “dashboard” which he now pairs with the current shared portfolio deck for subscribers to enhance our investment research service.
In this session, Rob will introduce the new dashboard and explain how our 2 key bottom-line stock scores work, and how they work together. Bring your curiosity, and bring your questions!
Tuesday, October 22
4:00 PM Eastern Time
Sign up in advance HERE
ROAR Score weekly update
The ROAR Score remains at 20 for the second consecutive week, since I reduced it from 30 to 20 on 10/8. However, there’s an important explanation here. I do see a path for the stock market to run much higher. After the move we’ve had though, I believe it is more likely to be an exciting, sharp move. That means it will be a brief thrill (weeks to months) similar to what we saw in the year 2000 (dot com bubble).
After that, anything can happen, in these complex and skittish modern markets. So, ROAR is “only” at 20 because in that narrow scenario, where I only allocate among SPY and BIL ETFs, the 20% in SPY gets me a piece of the action. But the 80% in BIL still yields in the 4.7% range.
In my broader portfolios (YARP, CORE, MacroTraxx), my positioning is more flexible and I can “have it both ways” by using many more methods of playing “offense and defense at the same time.” As such, I regularly capture more upside than a simple 2-ETF portfolio can, but with equal or better defense.
For each investor, it is a matter of deciding for themselves how much they want to learn about investing and the techniques modern markets have created for us to use.
3 Quick Thoughts on markets
I think the U.S. election is front and center in the market’s thoughts. That’s not a political statement. Just an observation that I think the market is bracing for…something. And frankly, nothing would surprise me between now and year-end.
That’s why I don’t dwell too much on where the “market” is going to go. My process is such that it allows each stock, ETF and index I follow to reveal its path. Then I follow that path. That probably sounds a bit vague, but the decision-making system I’ve built over the decades is anything but that. And it was built for markets like this.
I continue to see more of a “stock picker’s market” than we’ve had in a while. That said, I also see a continued pattern that is a feature (and a bug) of modern investing. I’ll summarize it this way: it is much easier to make a 10% gain in 3 months than it is to make a 10% annualized gain over 3 years. Stocks move up and down regularly, in wide swings. My solution is much more tactical management, much less buy and hold. More on this in the charts below.
3 ETF (or index) charts I’m watching
A WHOLE LOTTA SHAKING GOING ON
This is a chart showing performance of the “average stock within the top 1,000” (via ETF EQAL). These are 3 month rolling periods back to the start of 2022. What do I see? Exactly what I’ve felt, outside of a limited number of stocks, most of which do not pay much of a dividend. The losses and gains cancel out. This is nothing like the S&P 500. The question is, will one will copy the other over the next few years, and if so, which one? This is why many investors’ performance is as simple as how much “Magnificent 7” exposure they’ve had.
TEACHER’S PET
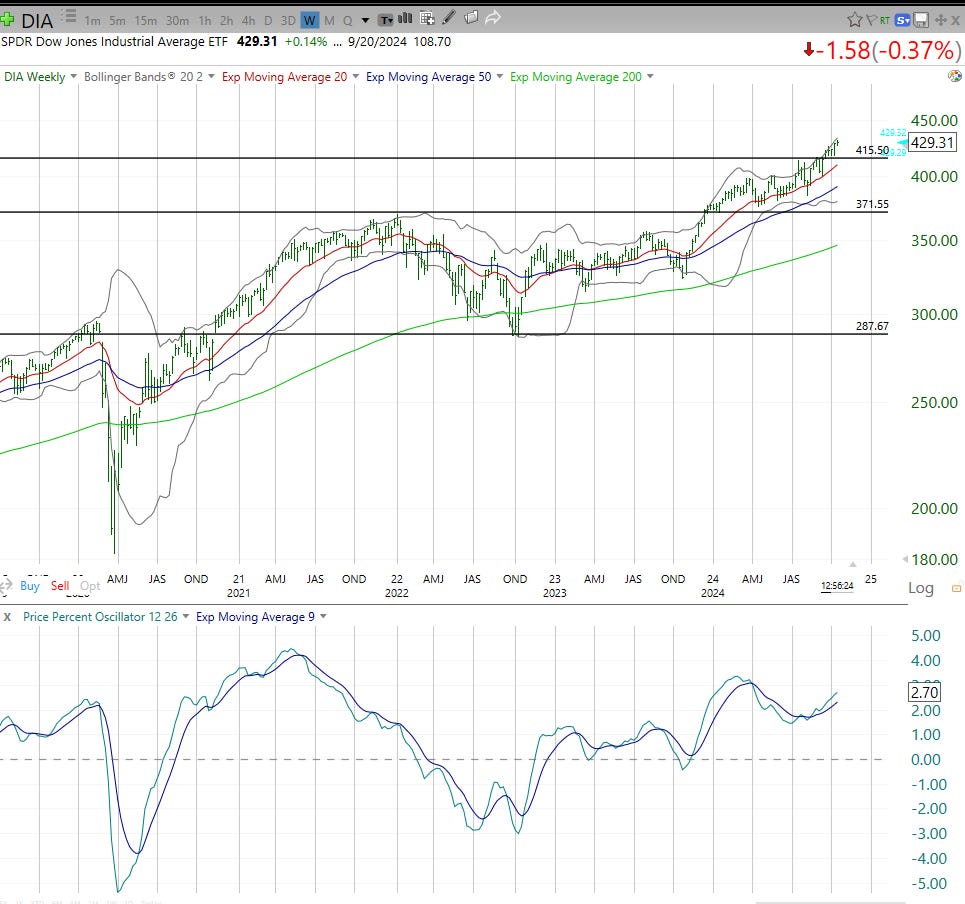
Have I mentioned that I love the Dow Jones Industrials much more than the S&P 500 or other stock market indicators? Answer: yes Rob, a thousand times! I am a Dow-phile, so if you are reading this and would like to see more Dow-centric analysis, I’d love to know. In the back of my mind, I’ve long believed that many investors can take these 30 stocks and get the majority of what they want out of stock market investing. That’s why every Dow stock that has a decent dividend yield gets a long look in my YARP stock selection process. The Dow has a shot to break out here. The next couple of weeks will tell us a lot.
INDUSTRIAL REVOLUTION?
The most optimistic side of today’s stock market climate is right here in this picture below. It is the weekly price chart of XLI, the industrials sector of the S&P 500. After a flat period from May 2021 through November 2023 (2 1/2 years), these stocks started to look better and better in a tech-crazed market into the current year. I started to notice this when I was first putting the YARP portfolio together last spring.
And, albeit with the use of a very ugly color combination, this chart shows how XLI moved steadily (orange trading range) and then to a steeper up move (purple trading range). The bottom part of the chart (circled) shows that there more juice here.
This sector is not cheap, but it is cheaper than the current market leaders. More importantly, on a case by case basis, I see some industrial sector laggards that have the potential to fly higher over the next 1-2 years.
3 stock charts I’m watching
BOEING, GOING, GONE?
There are 2 ways to look at the chart of this iconic company, that is clearly a mess right now. Either they get rescued or otherwise flip the script in their business, and this is a contrarian’s delight. Or, the hits keep on coming and it gets replaced in the Dow index, where it has been for 37 years. The irony, given my positive comments on Boeing’s sector (industrials) above, is that its price decline now leaves as the 13th largest holding in that XLI ETF. Hah!
WAL OF WORRY
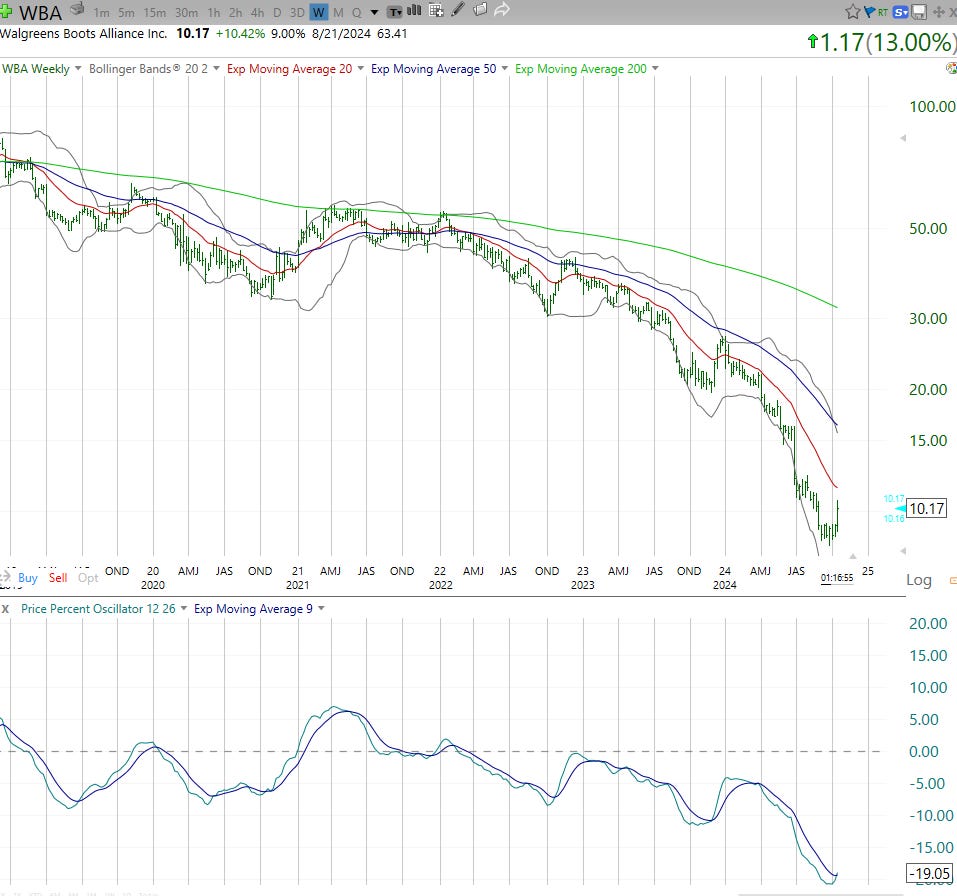
Speaking of candidates to leave the Dow, this one did earlier this year. And while there were the obligatory media stories asking “if it was a buy,” you can see what transpired since.
But now WBA has announced they are closing a lot of stores. Will that help? Will anything help? This is another one of those contrarian situations that intrigue me, but it might be too early in the process. What I’ve seen over the years is that there will eventually be a wholesale “flushing” of nearly all stocks, and at that point, the bargain-basement stuff like this will really be worth a look. But that’s not my forte so I’ll stop there.
INTEL OFFSIDE?
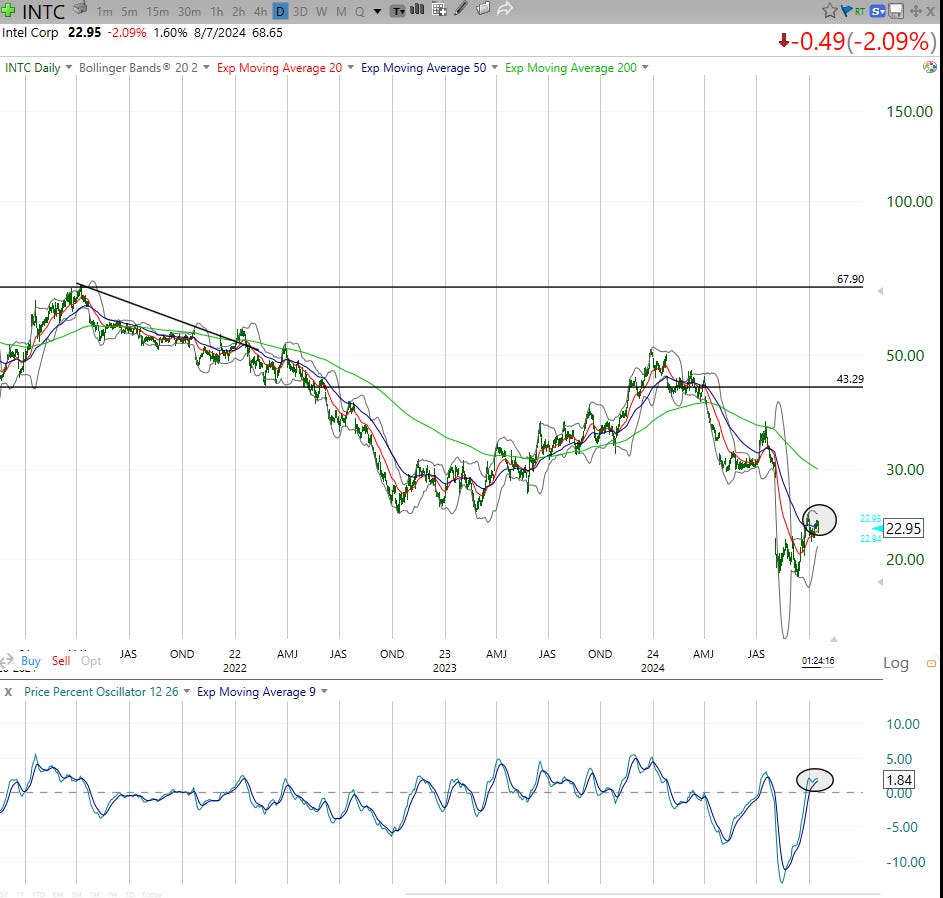
To complete this week’s trilogy of well-known companies with messy stock charts, here’s Intel. This is the problem with bottom-fishing. The first move off the bottom is a “gimme” like a 1-foot putt in golf (which I was known to miss in my golfing days). But after that, the real work begins, and that’s often where the excitement around the business runs out.
Sungarden Founder Rob Isbitts to speak at Money Show Orlando this Saturday
I am part of the Money Show’s educational provider group (i.e. not paid for as a sponsor), and after a few online sessions earlier this year, my first live session will be at the huge Money Show Trader’s Expo in Orlando next month. My focus: DIVIDEND INVESTING. Our subscribers know well that my views on dividend investing in modern markets are quite a departure from the “same old” and I’m grateful to the Money Show crew for inviting me to be part of this long-running event.
Registration for the 3-day conference is HERE and if you will be there, let us know. Dana and I will be there most of the day Friday and all day Saturday, the day I speak. We’ve love to meet any folks from the Sungarden community there and say hi!


