


ROAR Score weekly update
Our "Reward Opportunity and Risk" (ROAR) score remains at 40 for the 8th straight week.
This means a 2-ETF portfolio that can only be allocated to SPY and BIL would now be 40% SPY and 60% BIL.
To be clear, the main reason ROAR is not edging higher is the S&P 500 (SPY) itself. Explanation below.
3 Quick Thoughts on markets
"It's a setup" I muttered to myself today, while reviewing the stocks and ETFs I track for Sungarden Investors Club. Something was different this week. It might be just another passing phase, but a lot of stocks beyond the Mag-7 are showing signs of waking up.
At the same time, the "headline indexes look increasingly stagnant". It is at times like these I'm glad I am not the type of investor who insists on being "in" or "out," as opposed to doing what the ROAR approach does. Each week, we express here "to what extent we are in," where SPY and BIL are the only 2 choices.
The bond market has been non-committal, but increasingly, long-term rates look to be tipping lower. That would please POTUS and many Wall Street strategists. As for me, it just makes building my bond ladder a bit more urgent than if rates were decidedly upward-moving.
3 ETF (or index) charts I’m watching
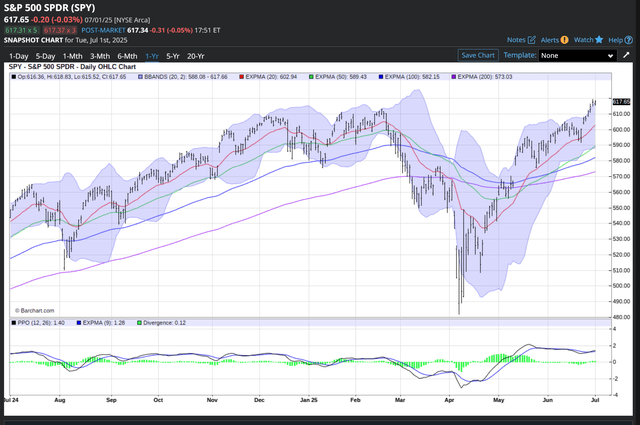
Many automated technical analysis "systems" have the S&P 500 ETF (SPY) as a "strong buy" currently. That seems more like yesterday's news to me. A better rating label might be "waiting for tariff deadline, confirming WW3 is off the table, and dealing with the summer doldrums." That's my current rating on SPY. Or in ROAR Score terms, a 40.
Some big-money investors might be buying 30-year US Treasury Bonds. That's the yield graphed below, not the price. Yield down = price up. But still around 4.8%. Close to its high water mark for the past 20 years. And ironically, right where that rate stood around this time of year in 2007. The S&P 500 topped out at the end of Q3 that year, and didn't stop falling until 18 months...and 55%...later. Something to keep in mind as we start the second half of 2025.

If rates are heading higher, this ETF has not received the message. This homebuilding ETF (ITB) is threatening to blow the doors off to the upside. But this one has had a lot of false breakouts recently.

3 stock charts I’m watching
Has Elvis re-entered the building? I doubt that, but perhaps Las Vegas Sands (LVS) has. Other than AI, I can't think of too many secular growth stories like gambling. This one is front and center in Macau, the China-based casino capital of the world. Though I'd argue that mantle has shifted to the US stock market.

Here's a chart of a company that might be the main reason people know where Cupertino, CA is. It is Apple (AAPL). Heard of it? Seriously, they are perceived as missing out on the AI thing. But some other thing is showing signs the stock is coming back into range, now 20% off its late 2024 all-time high.

Where have I seen this chart before...hmmm...oh yeah, immediately above. Pfizer (PFE) and AAPL look quite similar. I guess that's because they are in the same industry...not. Or perhaps because they are impacted by the same things in the rapidly-changing tech landscape...not. A lot of stocks that have been down recently look like this. Question is, will it be a fakeout...or a breakout? We'll know soon.

Final thoughts for now
The stock market might be shifting as I've pointed out above. But to me, the thing to look for is for the current market heroes and zeros to swap places when it comes to where investors put their money. That's great for we tactical types, if it follows through. If it does, that's a very dot-com bubble scenario, as I'll be opining on in a Seeking Alpha (Sungarden Investment Publishing profile on that site)article soon.
Lastly, some of you have asked about the Barchart tool we use to chart investments. We invite you to click here to sign up for Barchart and create your own charts!