ROAR Score weekly update
Our "Reward Opportunity and Risk" (ROAR) score drops to 30, ending a record-long streak at 40. But there's an additional warning below, so please take note.
This means a 2-ETF portfolio that can only be allocated to SPY and BIL would now be 30% SPY and 70% BIL.
I see the next several weeks as "make or break" for the good times in the broad stock market. Why? I see too many stocks breaking down on earnings, and all of the leading stocks look very stretched, price-wise. Read on, just in case today's 3s Report ends up being a "watershed" moment later this year.
3 Quick Thoughts on Markets
After carefully reviewing 40 ETF and stock charts that I consider to be my "inner circle" watchlist, I placed each ticker in one of the 8 chart grade "buckets" you see here. I always feel I have a pulse on what reward and risk are, and the tradeoff between them. However, this week was a bit different.
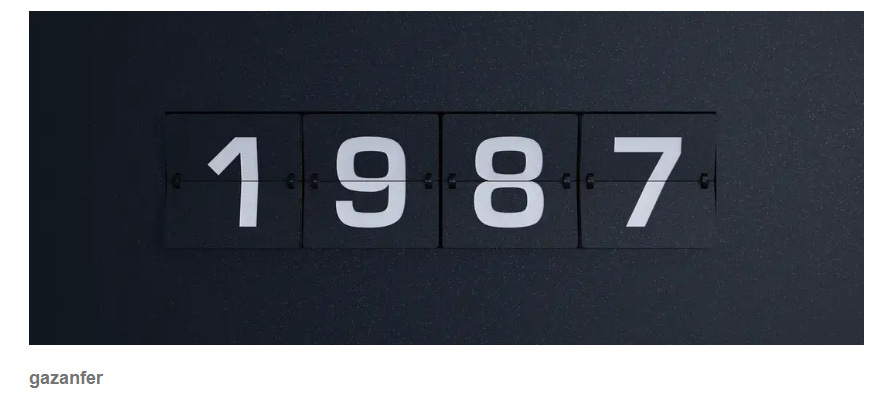
When I did, I found an overwhelming number in that "stretched" category. Like a rubber band that has not broken, but likely will. And it gave me pause. Because it looked too much like August of 1987, within 3 months of the crash that took the US stock market down 23% in a single day
Call me a gloom-doomer. I'll continue to refer to myself as a realist, and not a cheerleader for any market or stock. I am NOT predicting a crash, because predictions do not matter one bit in this business (though it seems to be the mission of many of my peers). I am just saying that there's the start of some stuff in the charts that makes the hair on my arms stand up.
3 ETF (or index) charts I’m watching
This might be just an informative history lesson. Or it might be a useful reminder of how risk management is really about preserving one's financial lifestyle. The latter is what I'm about.
I'll show the S&P 500, 3 different times, to make the case that August and September, 2025, are most critical months for the stock market. Particularly because now, more than ever the S&P 500 IS the stock market. More on that as my summer writings and weekly live investing group sessions continue.
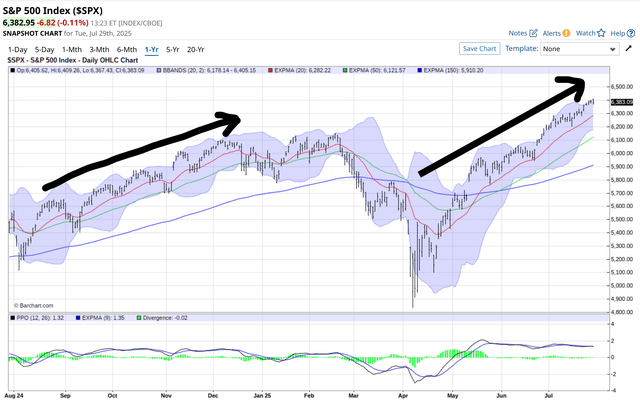
First, here's the S&P 500 over the past year, through early this afternoon. What do I see? A market so stretched, the PPO momentum indicator at the bottom of the chart has been "clueless" for several months. That either means the market is so happy with itself, nothing can bother it, or tip it over.
The other possibility is that this is the calm before a storm. If that turns out to be the case, I think we will set records for how many retail investors were completely caught off-guard, and panic will ensue. But NOT for risk managed investors!
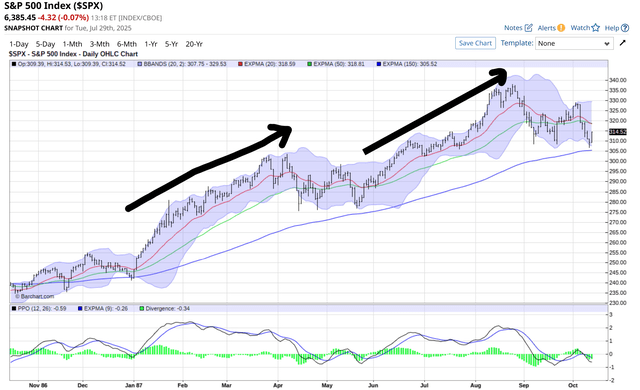
Below, here's the S&P 500 as well. Looks similar to me, at least through the end of July, where is we are right now. Then, a little "punch" higher, followed by a trading range. Check the year at the bottom: this is October 13, 1986 through October 12, 1987. My rookie year in the business.
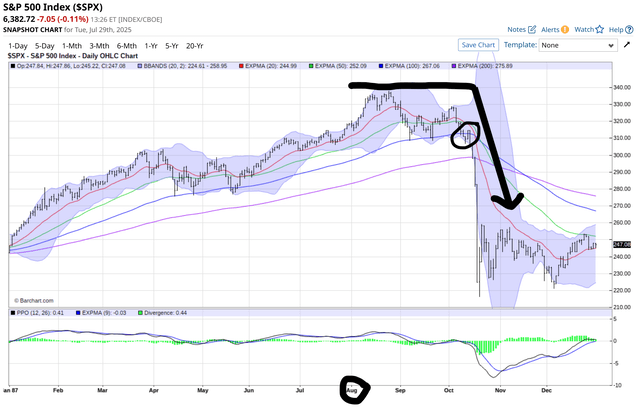
This is the full year 1987. All roses, pink clouds and puppy dogs through early October, though market-watchers at the time kept thinking "how long can this market be bullet-proof?"
They found out in mid-October, right after the chart above ended. I've marked the week all heck broke loose. I'm not Nostradamus, but I AM a risk-manager.
Now, check out the 3 current stock charts, and my conclusion to the "history lesson" shown above.
3 stock charts I’m watching
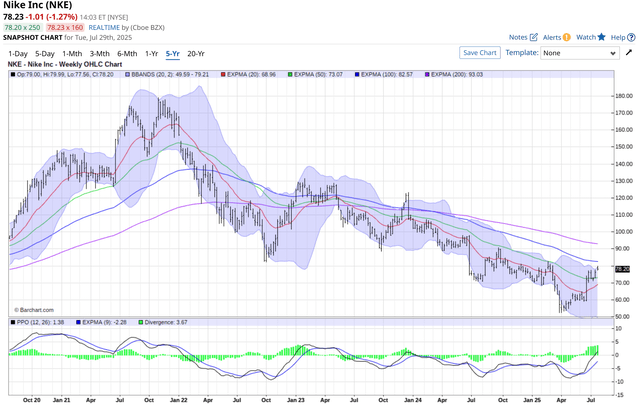
Let's start with Nike (NKE), which, along with McDonalds (MCD) and Wal-Mart (WMT), are the 3 Dow Industrials stocks that look best to me at this moment. That's a relative statement in an increasingly stingy market for ideas beyond "buy what's going up, because it's going up." In others words, I don't really like any Dow stock very much right now.
But the hope for NKE is that it is so "left for dead" by investors that at least on a multi-year basis, there might be something afoot here (pun intended).
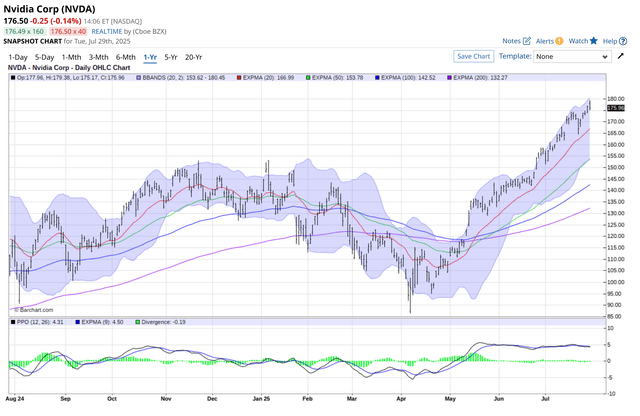
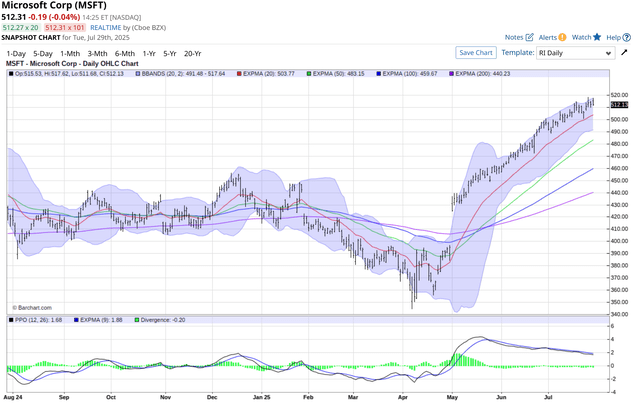
The other two stock charts this week combine to make up 15% of SPY and nearly 19% of QQQ. The top 20 stocks in the S&P 500 now comprise 48% of that index. If investors mark themselves to the S&P 500, 95% of the stocks no longer matter. And 90% really don't matter. To me, this prompts a MAJOR adjustment in how I put my money to work.
The good news: the key to me is the old expression "less is more." I'll be discussing the specifics with our live investing group session today, and next week as well.
To finish up, here's Microsoft (MSFT), which is the current 2-headed monster atop the S&P 500.
Final thoughts for now
Have I correctly warned about what turned out to be past market crashes? Yes, as recently as earlier this year, 2022 and 2020. Have I also warned about major market risk of decline, which turned out to be only a scare, as the S&P 500 surged much higher? MANY times!
But that's not what any of this is about.
I can only speak for myself. I hedge as part of my investing "lifestyle." Because I lived through 1987 as a young Wall Streeter, and through every bear market since. I can divide investors clearly into 2 distinct groups:
1. Those that hedge because they know they can't predict the future. But they can evaluate reward and risk at any point in the market cycle. By doing so, they commit to the idea that nothing is certain, and that means hedging to prevent having to worry about what they don't know, or have not experienced.
2. Those who don't because they think they can, or at least don't want to think about bear markets or sudden crashes until the next one occurs.


