

ROAR Score weekly update
Our "Reward Opportunity and Risk" (ROAR) score drops to 20 from 30 today.
This means a 2-ETF portfolio that can only be allocated to SPY and BIL would now be 20% SPY and 80% BIL.
I suspect this could be a period of transition for the broad stock market. More on that in my final thoughts below.
3 Quick Thoughts on markets
I continue to believe that risk is abnormally, historically, unshakably high. And it won't cease to be that way until stock prices across the board are as low as the "have nots" list I'm preparing for an upcoming article. There will be a "haves" list too. This is a redux of something I first did back in late 1999. I'll see if I can dig it up. I recall it was pretty telling, years later.
This does not mean that the market has to collapse. It means the chances of it collapsing are higher than normal.
Most charts look weak, many stocks have already broken down, and I have a sneaking suspicion that the bond market is going to matter to stocks again soon. The signs are there. The only question is whether the ROAR Score will rest for a while at this more risk-averse level as the picture gets clearer, or drop to 10 or even 0. Stay tuned, and recall that while Tuesdays is when ROAR is formally reviewed each week, any day can be "live."
3 ETF (or index) charts I’m watching
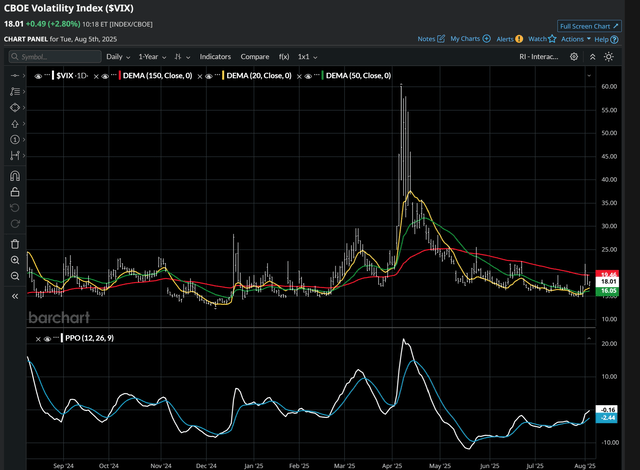
Volatility looks like it is warming up to pop higher. FWIW, I am seeing more ways to use volatility ETFs as a surrogate for options. Not a replacement, but more of a supplement. And one that, for many investors, is a simpler and just as effective way to manage risk. But as with options and any other investment, investors need to know what they own and the wide range of possible outcomes attached to owning it.
Another way I look at volatility goes well beyond VIX. This backward-looking, but very useful data point from Y-charts is available on any stock or ETF. It is not "VIX" per say, but it does help in analysis. Here's Y-charts' description of it, then my current take on it.
30 Day Rolling Volatility: Volatility is used as a measure of a security's riskiness. Typically investors view a high volatility as high risk.
Formula
30 Day Rolling Volatility = Standard Deviation of the last 30 percentage changes in Total Return Price * Square-root of 252 YCharts multiplies the standard deviation by the square-root of 252 to return an annualized measure. 252 is the number of trading days in a year.
Below, I've plotted something that really speaks to me about how much of this market is operating backwards. These 3 ETFs own the whole S&P 500 (market cap weighted) (SPY), the whole S&P 500 (equal weighted) (RSP) and just the top 20 stocks by weight (TOPT). The latter should be more volatile, and it usually is. But recently, the order is reversed.
Translation: the market is clinging to the biggest stocks, holding on for dear life. The rest of the market seems to be "toast" for now. How long can the biggest person on a tug-of-war team carry the whole team? We'll find out soon.

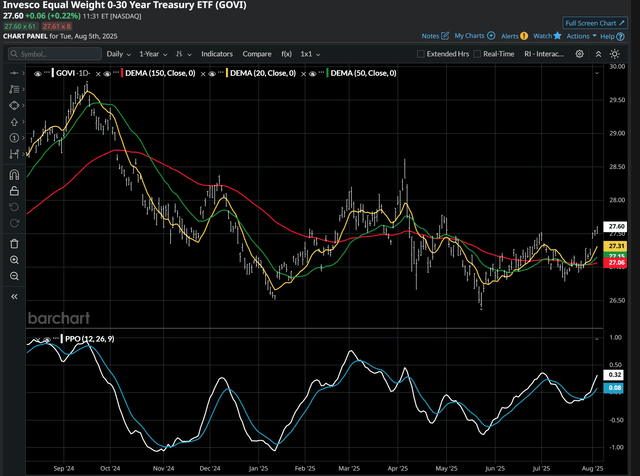
Meanwhile, one of my favorite go-to bond ETFs looks a bit more fabulous every day. Translation: if this bond ladder ETF is breaking out, yields are poised to drop. But there are many reasons that could follow through, and some of them are a reaction to investor panic. "Flight to safety" they call it.
3 stock charts I’m watching
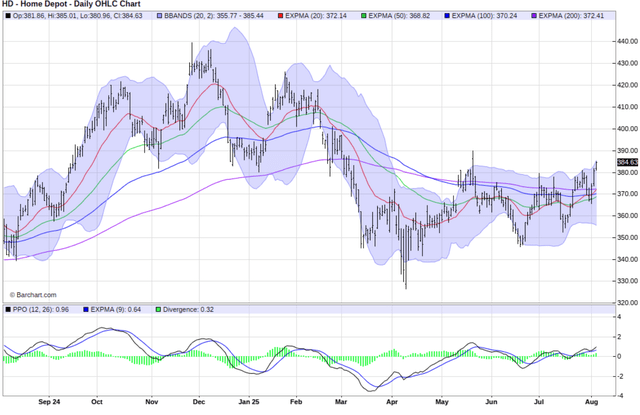
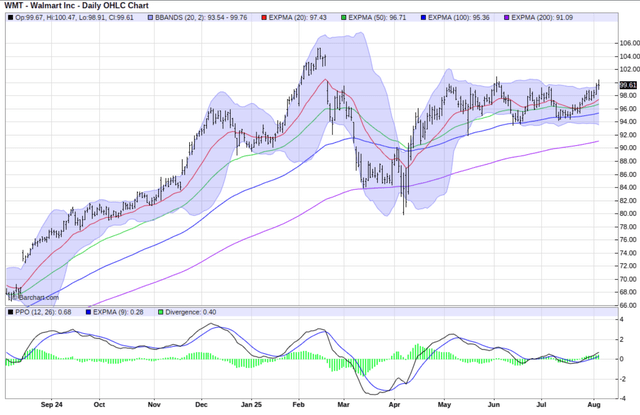
Why do I love being a technician? Because otherwise, I'd never allow the market to tell me its story, including the strong chart picture that is HD. Earnings are 2 weeks away, and there's a good shot at this one rising into that. What happens in 2 weeks? Anything can happen. That's the "event" nature of earnings reports. And lower rates may help, but for how long? But the chart is encouraging for now, while most stock charts are not.
Here's another Dow stock with a fighting chance. Lots of consumers in distress, trading down? China tariff situation about to be resolved? Ask the fundamentalist crowd (financial, not political) about that. I just see a higher-percentage shot than I see in most places. That also means that HD and WMT could be the last stocks to break down. We'll see.
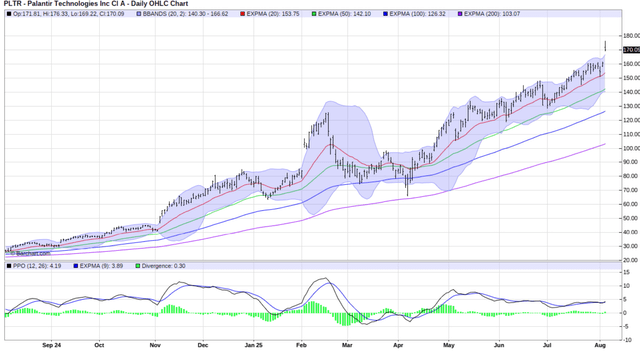
Palantir (PLTR) earnings, and the stock's strong positive reaction, keep hope alive. Microsoft (MSFT)'s chart looks like this too. All the more reason why I am increasingly convinced that investing has in some ways been simplified. Individual stocks are still valuable to own, but too many start to act alike, in packs, technically. That means a lot of wasted time trying to distinguish between them.
Final thoughts for now
ROAR in 2025 so far: there have been 31 weekly readings. For 11 in a row until last week, the reading was 40. For 9 weeks from February through April, when the whole tariff thing started and paused, ROAR sat comfortably at 10. (Do I feel like Casey Kasem, recounting this like American Top 40? You betcha I do!). However, in past market declines, ROAR does typically go from stable to less so. I sense that's starting to happen. August, September and October tend to do that to markets.
Why did I say above that the chances of it collapsing are higher than normal? A combination of overconfidence on the part of investors, the abandonment of solid risk management principles on the part of investors who have too much to lose (such as my baby boomer peers), and an uncanny preference for arrogance and bravado about markets, rather than anything remotely fundamental.
I'm a technician, but I feel for the folks who spent their careers analyzing businesses, only to see it turn into a casino. And it is all in the charts to me. I've seen this movie before. Many times.
Yet I am not for one second abandoning the pursuit of profits from rising prices of ETFs and stocks. Today's markets give us the gift of choice. The tool box is larger than ever. Let's take advantage of it.