

ROAR Score weekly update
Our "Reward Opportunity and Risk" (ROAR) score remains at 40.
This means a 2-ETF portfolio that can only be allocated to SPY and BIL would now be 40% SPY and 60% BIL.
Records are made to be broken. This is the 11th straight weekly reading of 40 for ROAR. There's good reason for that, so read on below.
3 Quick Thoughts on markets
Why do I like bond ladders in this environment? Because the US Treasury yield curve keeps delivering for me.
The S&P 500 and Nasdaq 100 are either topping out, or waiting for another magical earnings season to drive yet another leg higher. The next 2 weeks will send plenty of signals.
I continue to believe this is the most dangerous AND opportunistic market of my career, spanning nearly 40 years. Let's get into why, using some charts.
3 ETF (or index) charts I’m watching
In red below, that's the curve as of "liberation day" on April 2 of this year. The blue is the current curve. Not much change until you get out to the 10-30 year range. That's elevated, as the market frets about the possibility of the US debt level becoming more challenging than it already is. More in the next chart.

Here is the 30-year US Treasury yield going all the way back to 1980. Want to know why markets behave so differently than even 5 years ago? THIS is the reason. And while rates could certainly lift higher, it has been 18 years since investors could earn 5%-ish going out 15-30 years. And as our club members know, I approach a bond ladder as the main part, but not the only part, of my bond portfolio. The other is using ETFs and options to add to my potential return, whether rates go up or down over time.

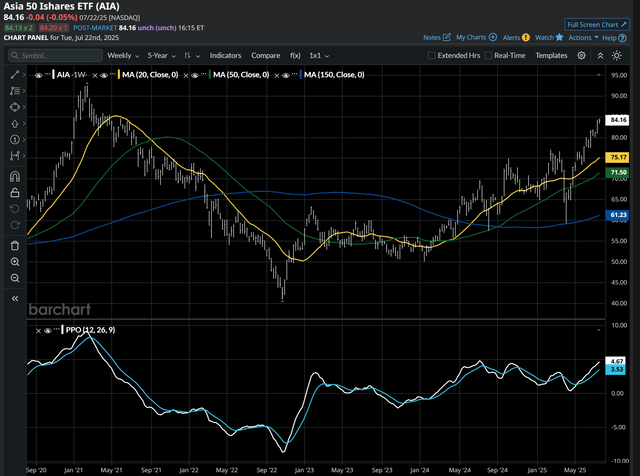
The best-looking ETF among those I follow is not one that invests in the US. It is AIA, which is the Asia 50 index. I've been tracking it for a while, and it is building slowly, steadily. I can see a scenario where the August to October period is one in which Asia outperforms the US. Maybe they even go in opposite directions. But I'm not a crystal ball guy, I just keep listening to the market's story as it evolves. Note that while this is an "Asia" ETF, 41% is allocated to stocks in China, another 33% to Taiwan, and 6% to Hong Kong. That's 80%. So to be clear, this is a "China ETF." And it seems to signal that China is about to have a leg up on the US in regards to stock market upside. If that comes to pass, you can tell your friends, "the charts told me!"
3 stock charts I’m watching
NOTE: as I do at this time each week, I started going alphabetically through the roughly 40 stocks I pay the most attention to. I was looking for a trio that I could use as cases in point to simply state "what's the market trying to tell me, at least right now? I found all 3 before even finishing the letter C. Here we go.
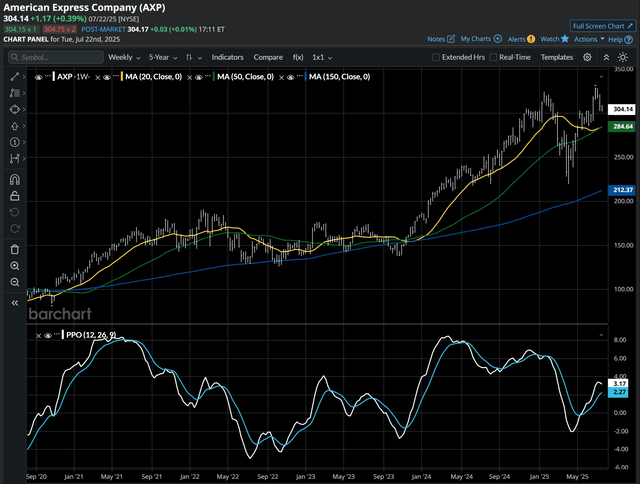
AXP: US high end consumers finally extended like a rubber band, too far. Stock looks vulnerable.
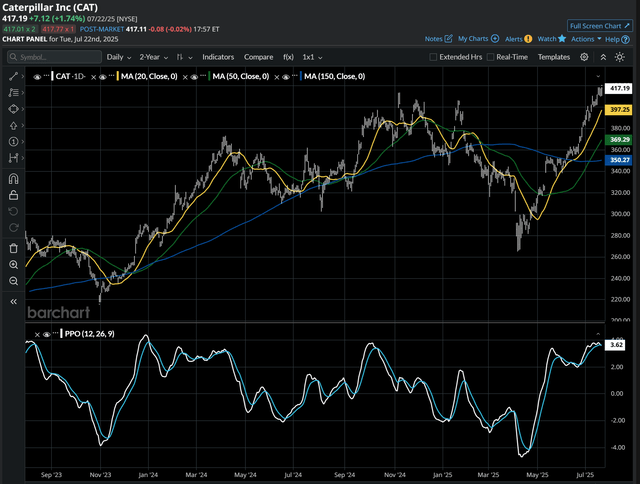
CAT: 2025 for machinery/infrastructure, so far: tariffs, oh no!...so what, this economy is gonna boom!...hey, maybe we should all re-think that, at the same time. This is a pause to refresh or a dangerous perch. We'll know shortly.
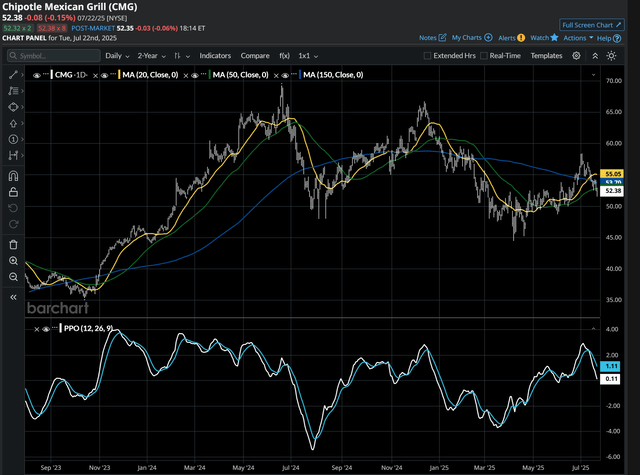
I told someone recently that I see investing today as more about taking an intentionally limited set of ingredients (ETFs, maybe stocks), and making a wide range of "meals" out of them. Self-directed investors all have their own concept of what is attractive to them, but there's a common core that they should learn before stepping out. Better than just experimenting.
But for CMG, sourcing those ingredients with tariffs overhead is one issue. The other, and perhaps tougher one, is grappling with a core customer base that is enduring a tougher job market, education, car and/or mortgage loan repayments. As they say in Spanish, "buena suerte" (good luck). I own CMG, but it's collared with options. So I've already decided what my loss limit is, which means no surprises around earnings or otherwise. At least, none I have not yet accounted for. Why don't more investors use option collars? I just don't know. But if they want to learn how, we're here.
Final thoughts for now
That long-term rate chart is one I can't unsee. And I think all investors should understand it. Because it is not just about the bond market impact.
Long-term rates fell on their own, or were helped by the Fed suppressing rates, for a very long time. How long? MY ENTIRE CAREER. Then, coming out of the pandemic, and especially starting in 2022, rate hikes started the new bond bear market. It's just different now. But most newer investors are equity-driven, and don't see how this 40-year bond bull market ending in 2020 will impact them. It will. How? As they say, gradually...then all at once.