


ROAR Score weekly update
Our "Reward Opportunity and Risk" (ROAR) score remains at 20 for 6th straight week.
This means a conservative 2-ETF portfolio that can only be allocated to SPY and BIL continues to be 20% SPY and 80% BIL.
A more moderate version of that SPY/BIL 2-ETF portfolio would be at 60% SPY and 40% BIL. That is based on our methodology that allocates 50% to SPY and 50% to the ROAR Score.
3 Quick Thoughts on markets
I am always looking closely and carefully with a risk-managed eye, something I've done professionally since the early 1990s. And along the way, there have been markets like this. The type that lull investors into complacency.
As we'll see in the charts below, there's a tell-tale sign that things will again get "interesting." But rather than time it, I balance reward and risk at all times. Including now.
Falling US Treasury rates on Fed rate cut hopes could be a helpful aid to keep the stock market rally going. But by "stock market" I mean the same cadre of stocks that have led the market higher. As for the rest? I believe the technical term is..."yuck."
3 ETF (or index) charts I’m watching
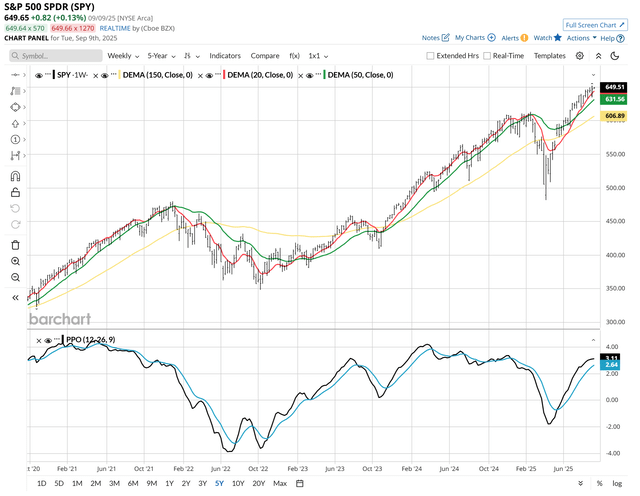
I usually fill this space with daily charts. But here, I'm showing the S&P 500's (SPY) weekly chart covering the past 5 years. Because it is a great picture of where things stand, how tenuous they are, but how nothing has busted yet (up or down). SPY is holding up well, but that PPO at bottom is what I'm watching. If a weekly rolls over, crosses and the price goes lower in sync, that's when risk management will get a lot more important, very quickly.
Note: the average S&P 500 stock since Thanksgiving last year is about flat. This is a strong, but not healthy stock market.
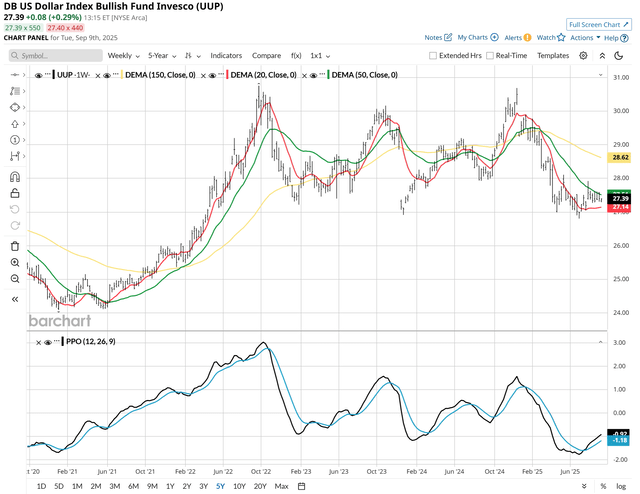
Here's the US Dollar,, and its next big move might be the key to this market. This is also a weekly chart covers the past 5 years, and this ETF (UUP) is in familiar bottoming territory. But the stakes are a bit different now. So that tells me that if the Dollar can't hold these levels, the "break" will not be subtle. It will be headline-grabbing.
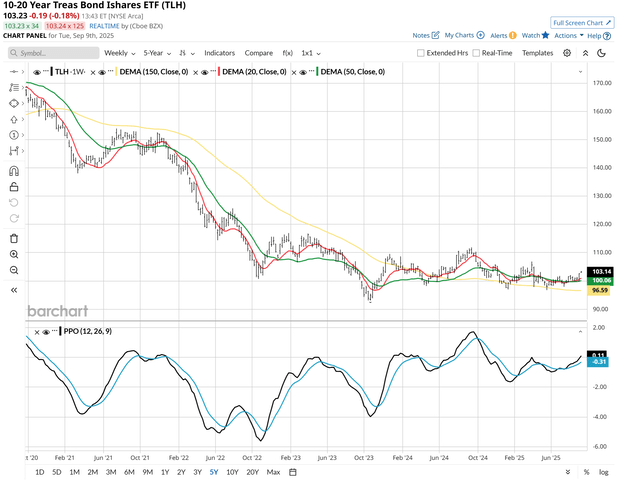
Many investors know of and trade the 20-30 Year US Treasury ETF (TLT). This is the lesser-known but more intriguing 10-20 year Treasury ETF (TLH). Along with much of the yield curve, this is increasingly looking like it could rally. But headlines will likely knock that price around before it makes the next big move.
3 stock charts I’m watching
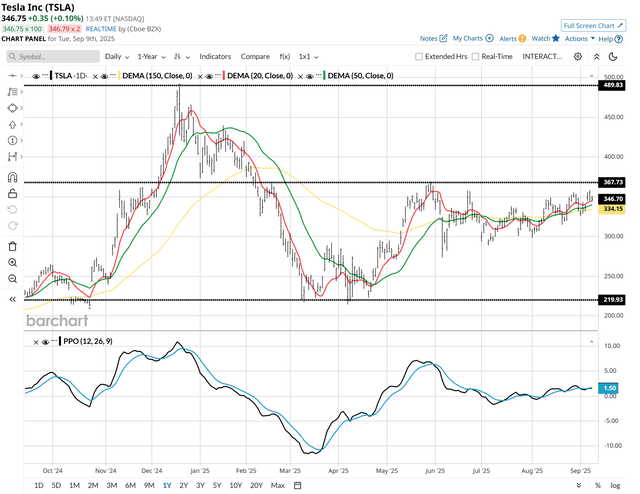
There are a lot of forgotten large cap stocks trying hard to get noticed again. At least chart-wise. Conagra (CAG) is typical of many I see. There's a ton of upside "potential" there, but we've seen this act before. That's how it lost nearly 50% of its value the past 12 months.
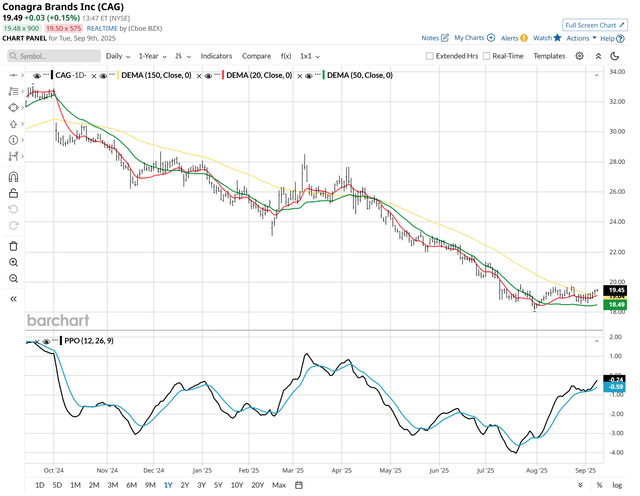
I'm not a huge fan of this company like others are. But I don't root for stocks or companies, I invest in and trade them. And this is getting closer by the week to at least having a shot to break out above the $370 area. So I'm watching.
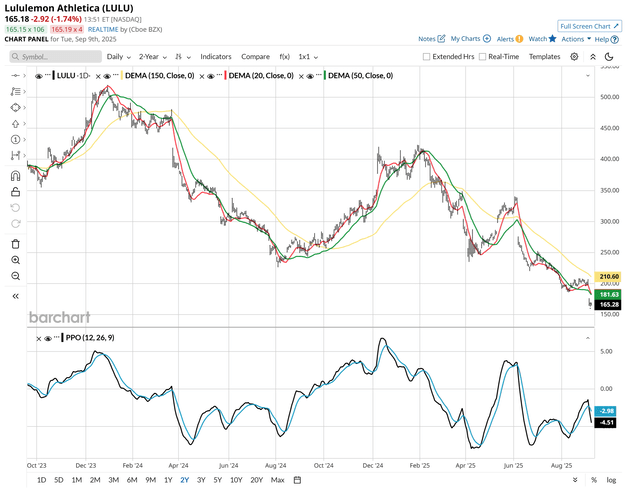
The difference between "hot" and "not" is so slim sometimes. Lululemon (LULU) was a market favorite for a while. Now, those who bought the "forward-looking" analysis have seen 2/3 of the value disappear in just 2 years. This should be a heads-up for holders of stocks with "great growth potential."
Final thoughts for now
I'm much more concerned with the next "big" move than the daily parlor game cocktail of Mag-7 stocks, the Fed and the tariff-driven headlines. I learned a while ago that "what everyone knows is not worth anything." That's why I'll bide my time and look for serious clues in the charts, more so than the chatter.
The first rule around here is ABL: Avoid Big Loss. But when I say "big move" in the markets, as I did above, that can be in either direction. The longer nothing happens, the more something "big" will follow it.