
The ETF Yourself Depth Chart
Creating your personal investment map to focus your investment research, and make clearer decisions.


I’m a big believer in simplicity in investing. Modern markets demand it. We can agree on using simpler techniques to manage a portfolio, including building it with ETFs. But how many should we track? That depends on how you plan to use them.
ETFs are widely misunderstood by the investing public. Part of that is due to the sheer number of choices. There are more than 4,000 of them listed, just in the U.S.
To me, while they represent potential securities to own, there’s another, very opportunistic way to view them: as a map of the market.
Below, you see my “DEPTH CHART.” It contains 75 different ETFs.
The 2 tables are set up the same way, except the first one tells you which market segments are tracked. The other simply shows the ETF tickers that correspond to each market segment listed in the first table. I’ve concluded that these create a nice broad road map to monitor the global markets.
That doesn’t mean I will consider owning all or even most of them. But I want to track them, because they represent potential clues as to what the stock market and other markets offer us at any point in time. Especially, where the risks are.
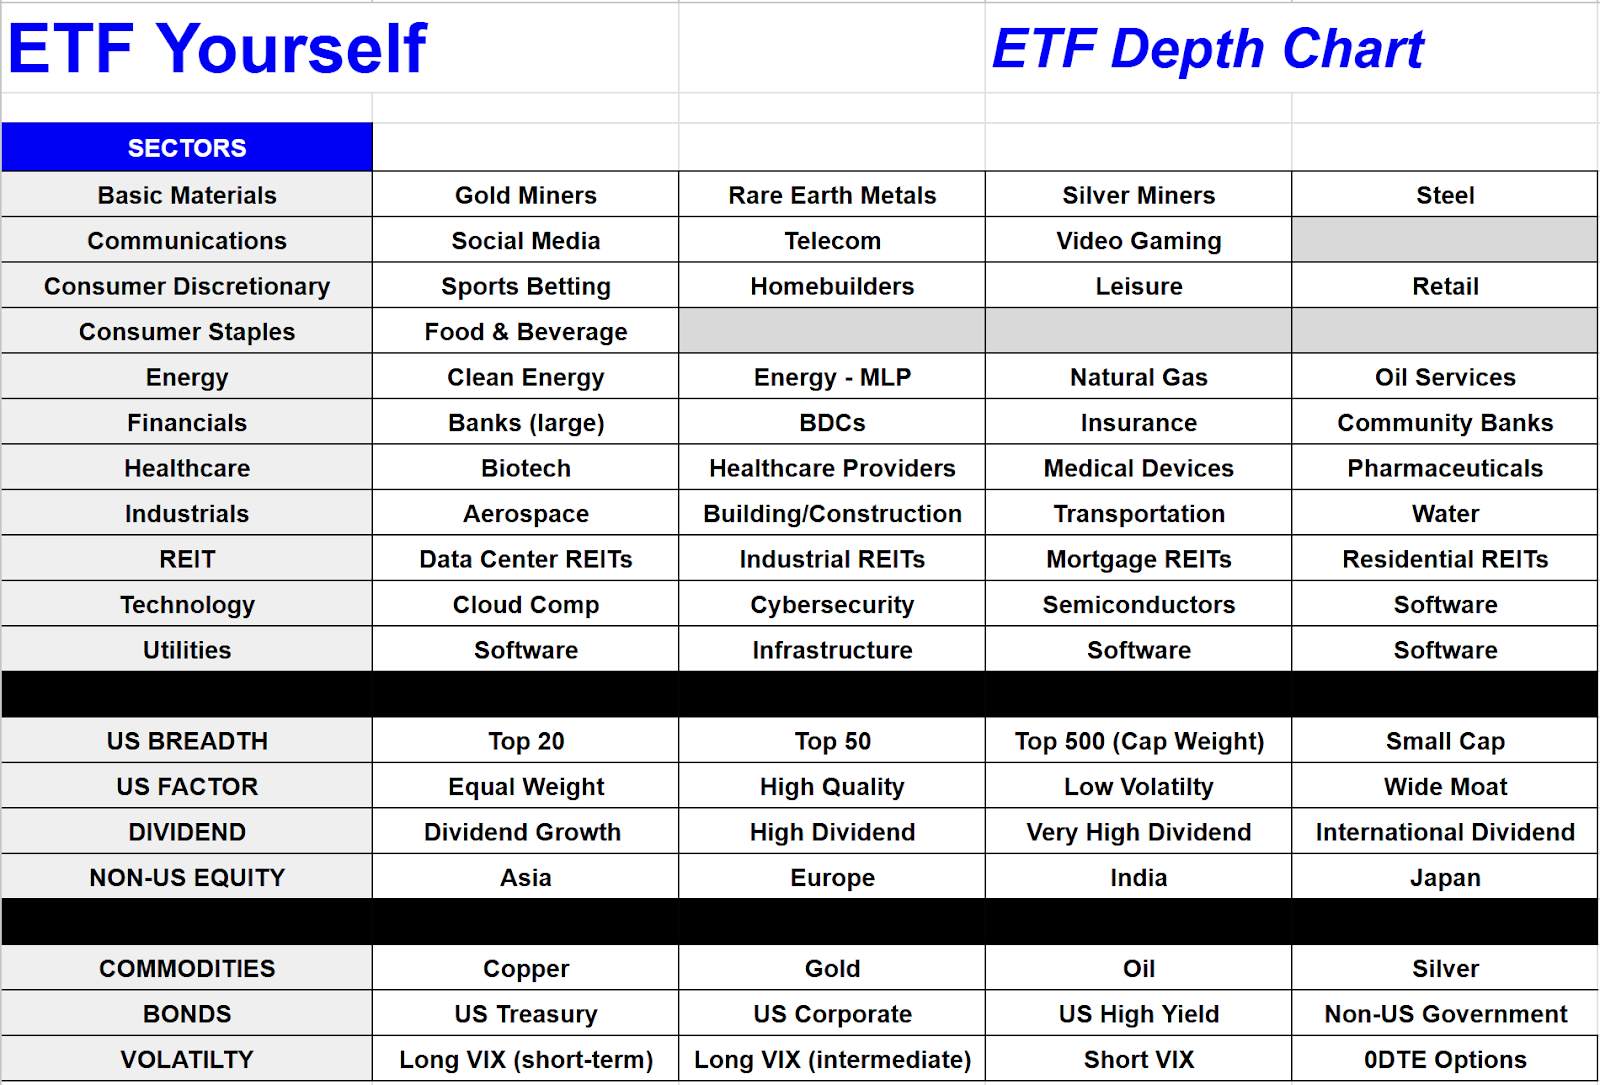
Above, this first view starts with the 11 S&P 500 sectors. That index has 500 stocks, and each one is assigned to one of 11 sectors, like Energy and Healthcare.
Within each of those sectors, I’ve defined up to 4 industries within those sectors. For example, with Technology, there’s Cloud Computing, Cybersecurity, Semiconductors and Software. They act similarly much of the time, but they are different enough that I might find clues in examining them separately. Tech is one sector with many industries within it. Other sectors, like Consumer Staples, have virtually no sub-divisions that can be accessed via an ETF.
The next set of 4 categories helps round out the equity market portion of the depth chart. “Breadth” refers to how well the biggest stocks are doing versus the “average” stock. The early part of the 2020s decade was defined by historically strong performance by the biggest stocks, such as the Top 20 or Top 50. While smaller stocks, including a version of the S&P 500 that weights stocks equally (not by company size) lagged consistently. If and when these notoriously cyclical aspects of stock investing shift, I use the depth chart, and my charting techniques, to identify when that’s starting to happen.
There’s an advantage to figuring out a trend before the masses do.
The depth chart continues with factors, a range of different dividend ETFs, and some ETFs that invest in stocks outside of the United States.
The final section goes beyond stocks, identifying some key segments of the commodity and bond markets. Finally, volatility is a quirky yet intriguing part of the ETF investing world. These are among the most volatile ETFs, since their price movement is similar in some respects to options.
And, here’s the same depth chart, but with ticker symbols instead of segment names.

Some names on this depth chart, including the sectors and S&P 500 are essentially permanent members. The Nasdaq 100 (QQQ) and Dow Jones Industrial Average (DIA) are excluded here, since they really are indexes and not sectors. And, I watch them constantly through the other aspects of my research.
The ETF Depth Chart: make it your own
Your main takeaway from this discussion should not be “which ETFs should I buy,” but “which ETFs do I want to personally care about?” We are here to help you sort through the more than 4,000 US-traded ETFs to figure out which ones correspond to the areas you want to consider for potential investment, or just to track the markets through.
Some investors look at 2 ETFs. Others, a few, or maybe 10-12 of them. For others, they want a wider range. There are so many ETFs (too many!) and that creates confusion for investors.
At ETF Yourself part of making investment simpler is to separate what matters from what doesn’t. That’s a personal choice you make for yourself. But since I’ve been analyzing ETFs since 1993 (when the first one debuted), hopefully I can help you avoid overthinking this part of the long-term investing process.