


Alpha: How much you make above and beyond what the market gives you.
Beta: How much volatility you endure on the way to trying to profit.
Capture Ratio: How well you do in the good times versus how well you manage risk.
That’s it. That’s the ABCs of investing. And between the way the market is behaving, and the way investors are ignoring the defensive side of the portfolio, the more I am convinced that there’s a lot of overconfidence around us.
I say “us” because if you read ETFYourself.com, you have already decided you are serious about managing risk. Before I cover a handful of charts I think are most worthy of your attention this week, feast your eyes on this data table.
You can also see it by clicking HERE.
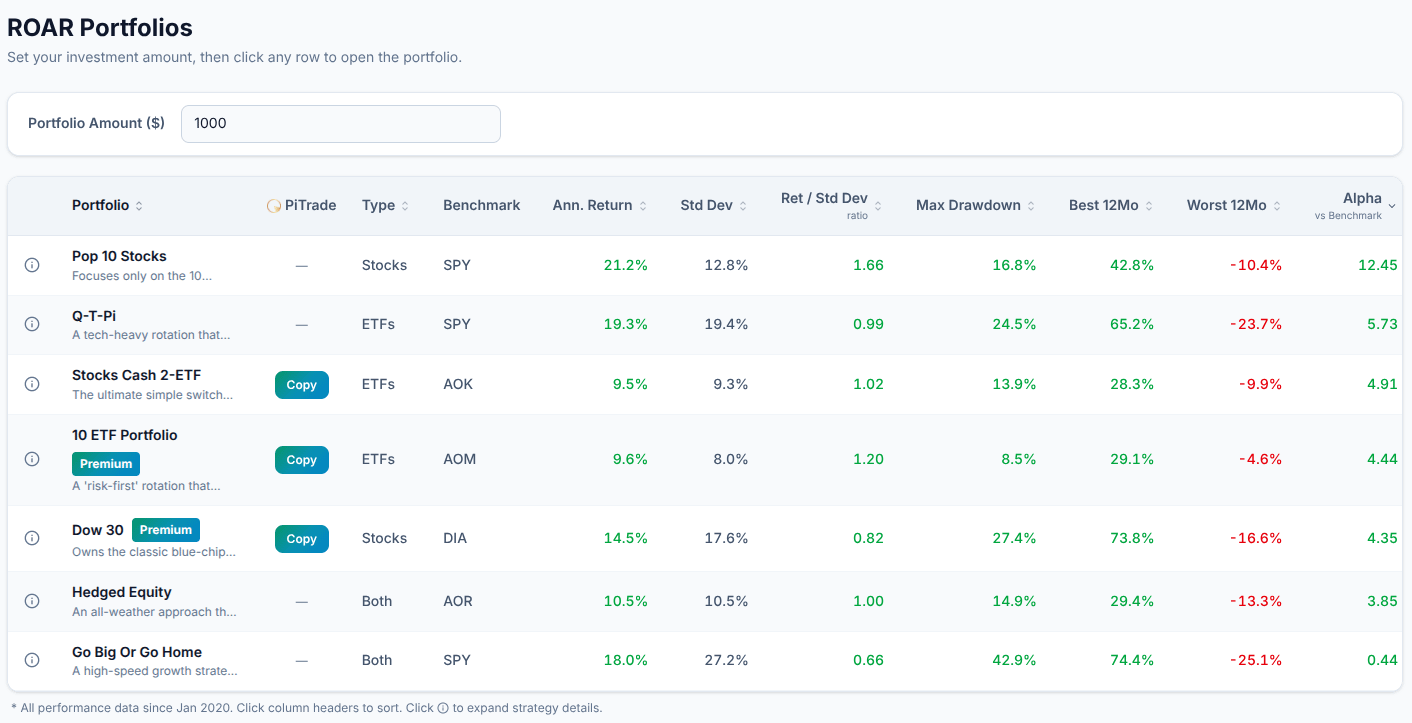
Different investors will gravitate to different lines in that table. Each row is one of the model portfolios I run. Three of them are available to copy trade for free at PiTrade.com. They are all available to our premium subscribers to view 24/7. And many are able to be viewed by anyone, subscriber or not.
You’ve heard about some of these. Here’s the performance of these automated models, which we continue to update daily at ROAR.PiTrade.com. The Alpha column shows that every one of these has added value versus its benchmark. You can also see the returns, and the range of best/worst 12 month period.
There is no live session today, Tuesday 6/2. However, at our next one, Tuesday 6/9 at 4PM ET, I will be teaching one of the most important aspects of investing very few DIY investors ever learn: how to assess your own performance. And how to express in Wall Street terms what you are really looking for. Outcomes, not narratives.